
Photo of Hudson

Hudson Smith

UC Berkeley Applied Mathematics Graduate

Hi, I’m Hudson, a recent UC Berkeley Applied Mathematics graduate looking for entry-level roles in data analytics, data engineering, or software engineering.

In my projects, I’ve worked with real-world datasets from initial cleaning and exploration through modeling and presentation. That has included writing Python and SQL, working with APIs, comparing machine-learning models, and creating web interfaces for the results.

Most recently, I developed an I-80 closure-risk project using historical weather and manually reviewed closure records, then deployed its data pipeline with AWS Lambda and S3. I’ve also analyzed waterpark sales data to study demand patterns and compare predictive approaches.

Featured Projects

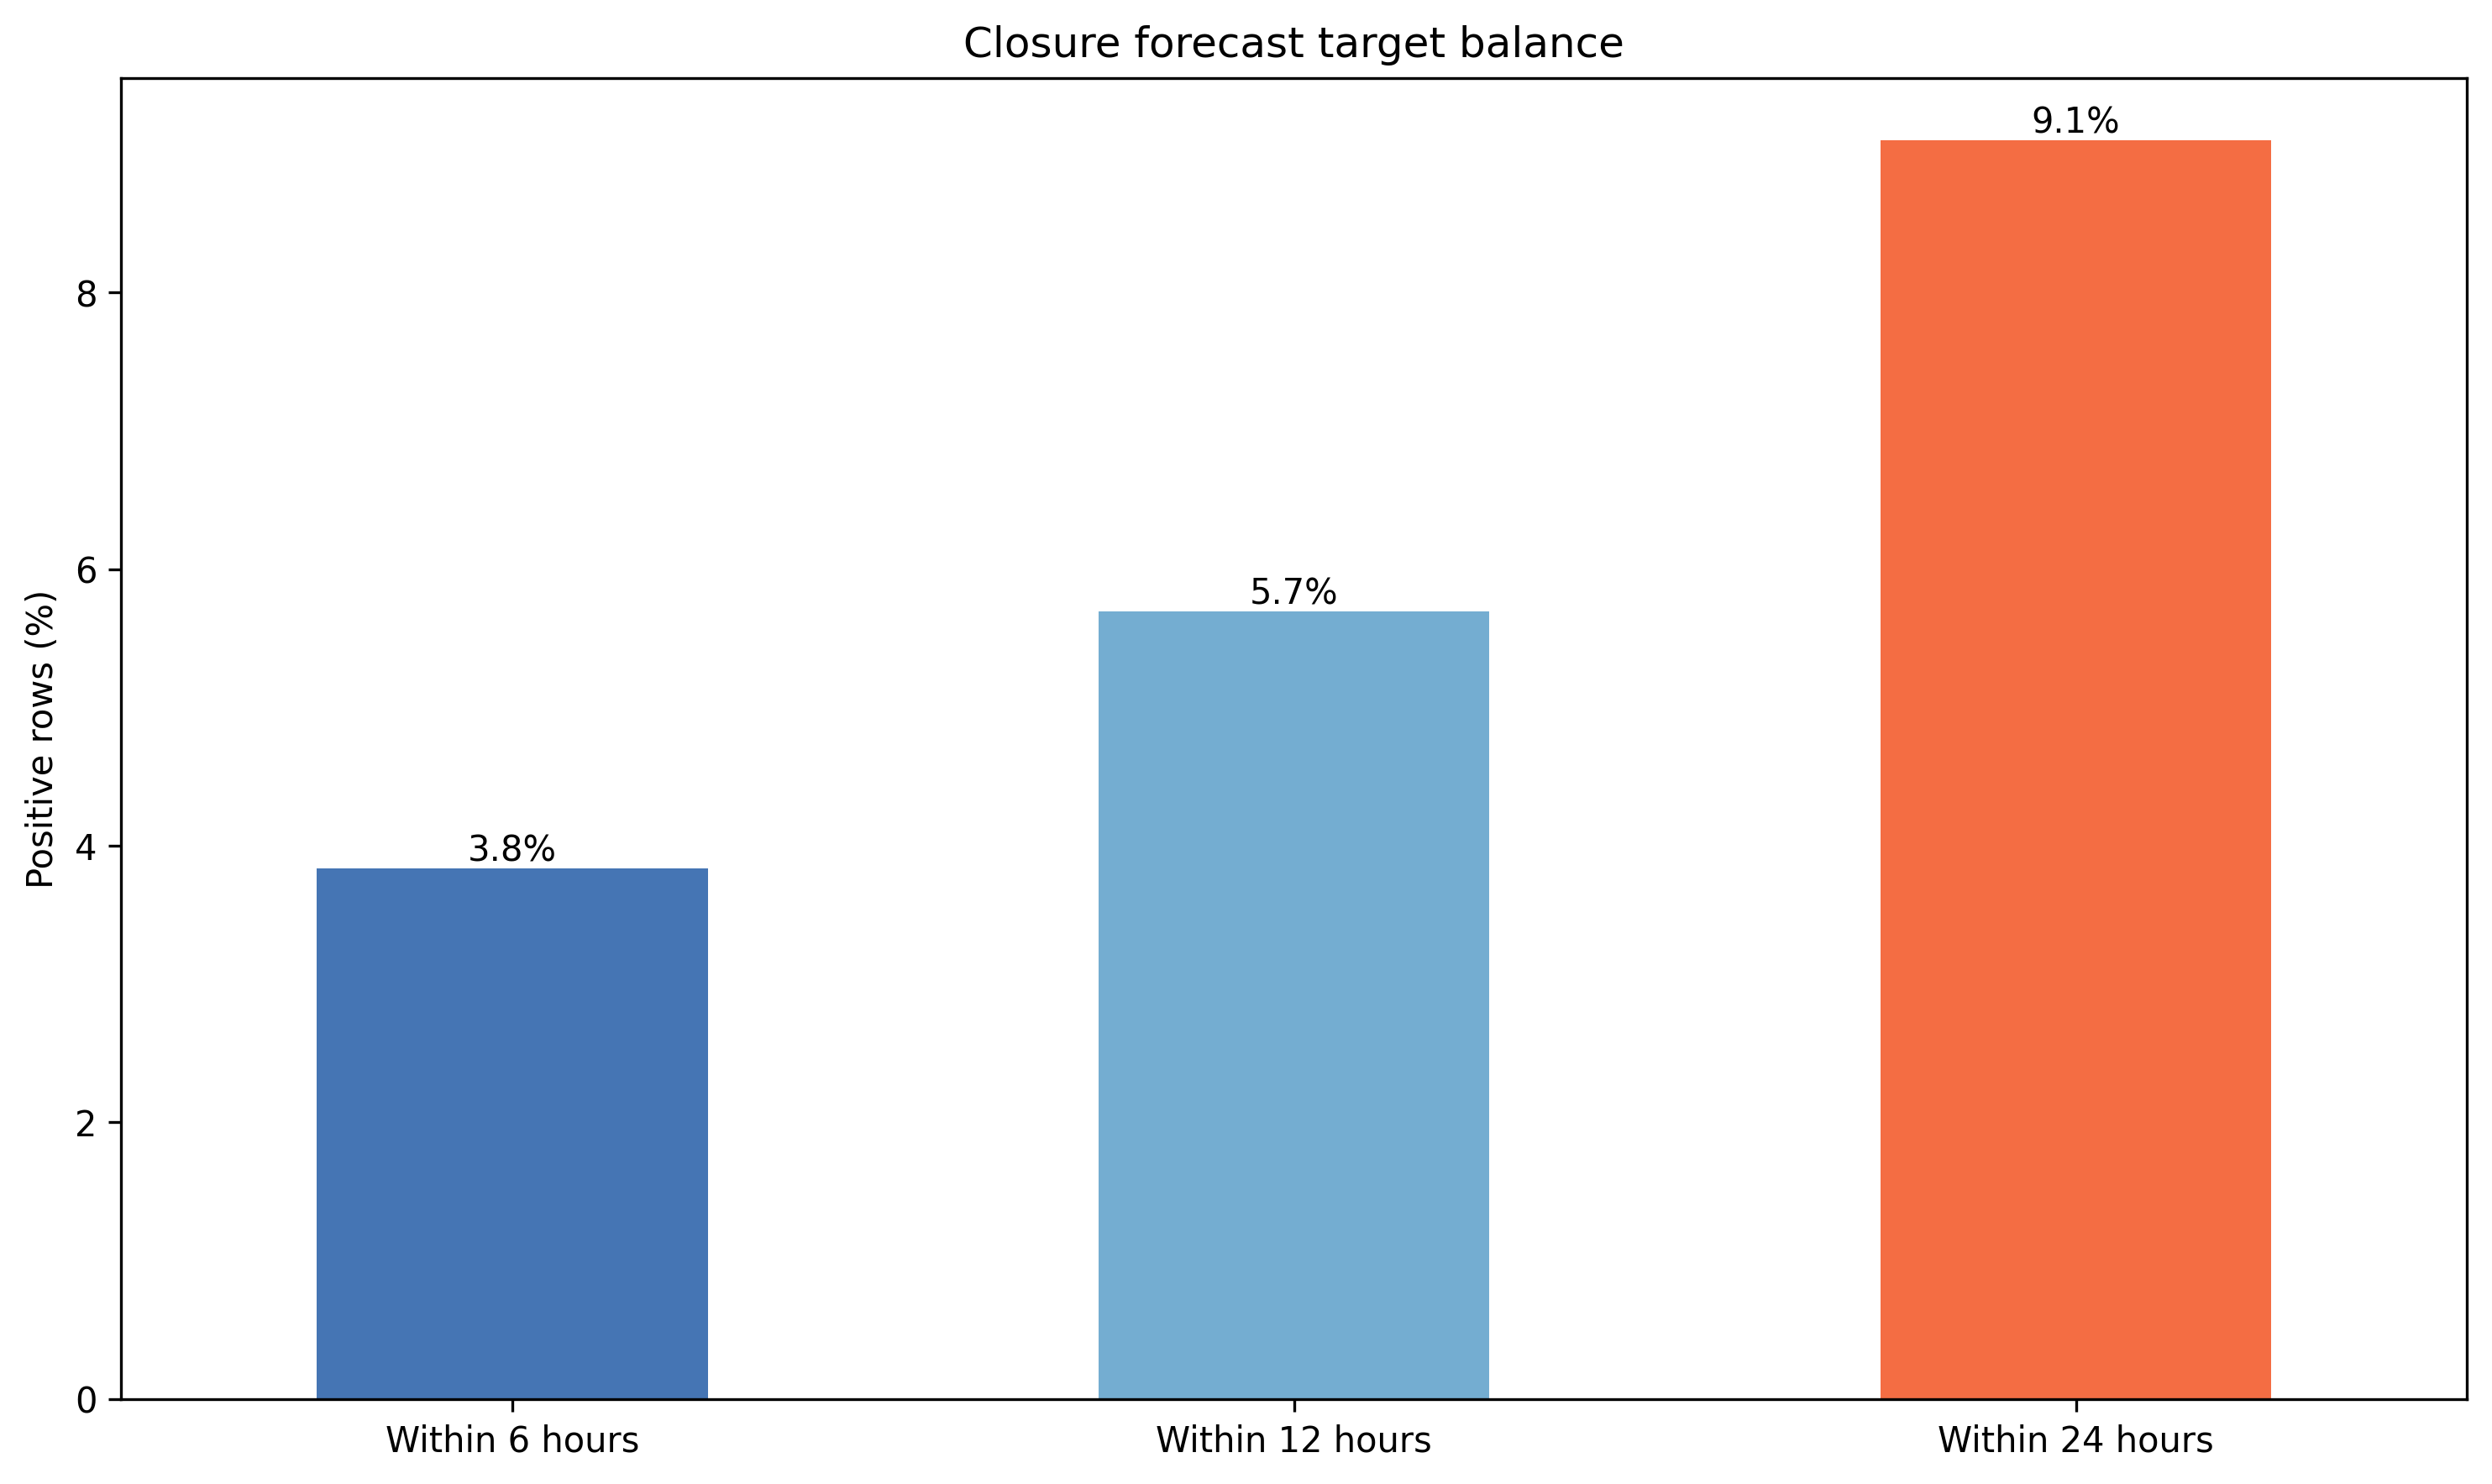
Closure forecast target rates for 6, 12, and 24-hour horizons
The 24-hour target captures more closure events while preserving a challenging class imbalance.
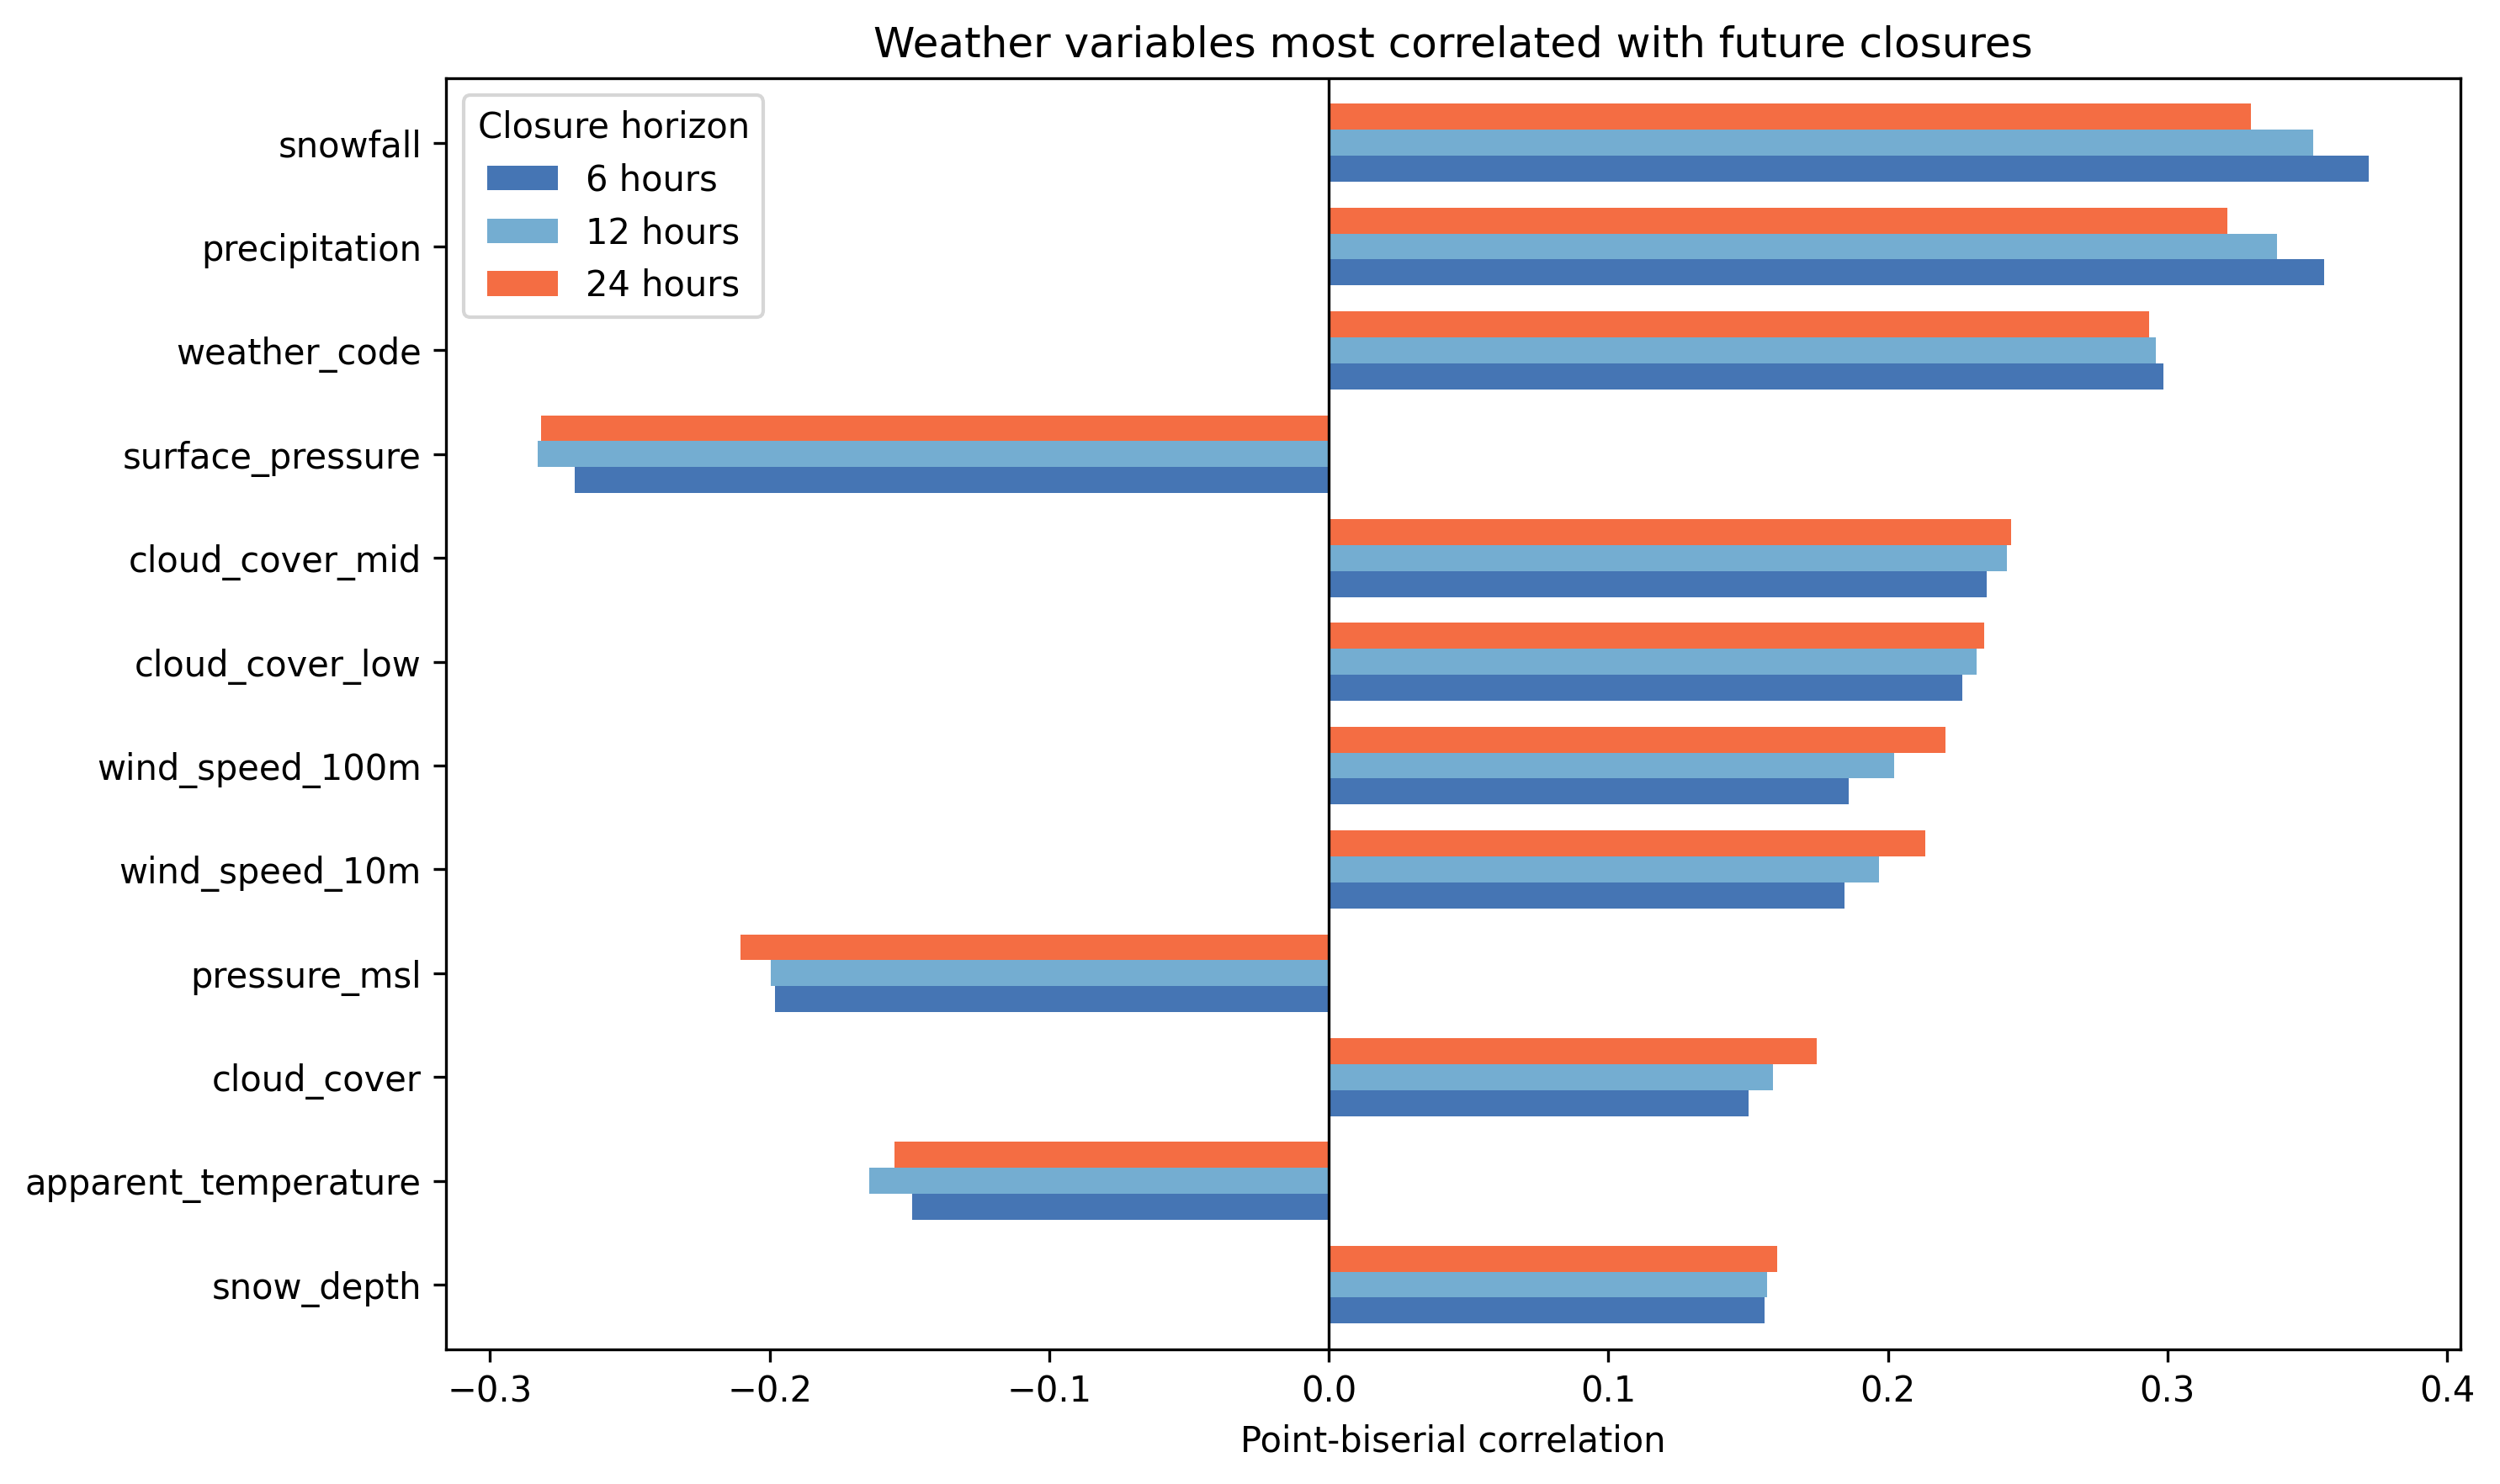
Weather variables correlated with future I-80 closures
Snowfall, precipitation, weather severity, and pressure show the strongest relationships with future closures.
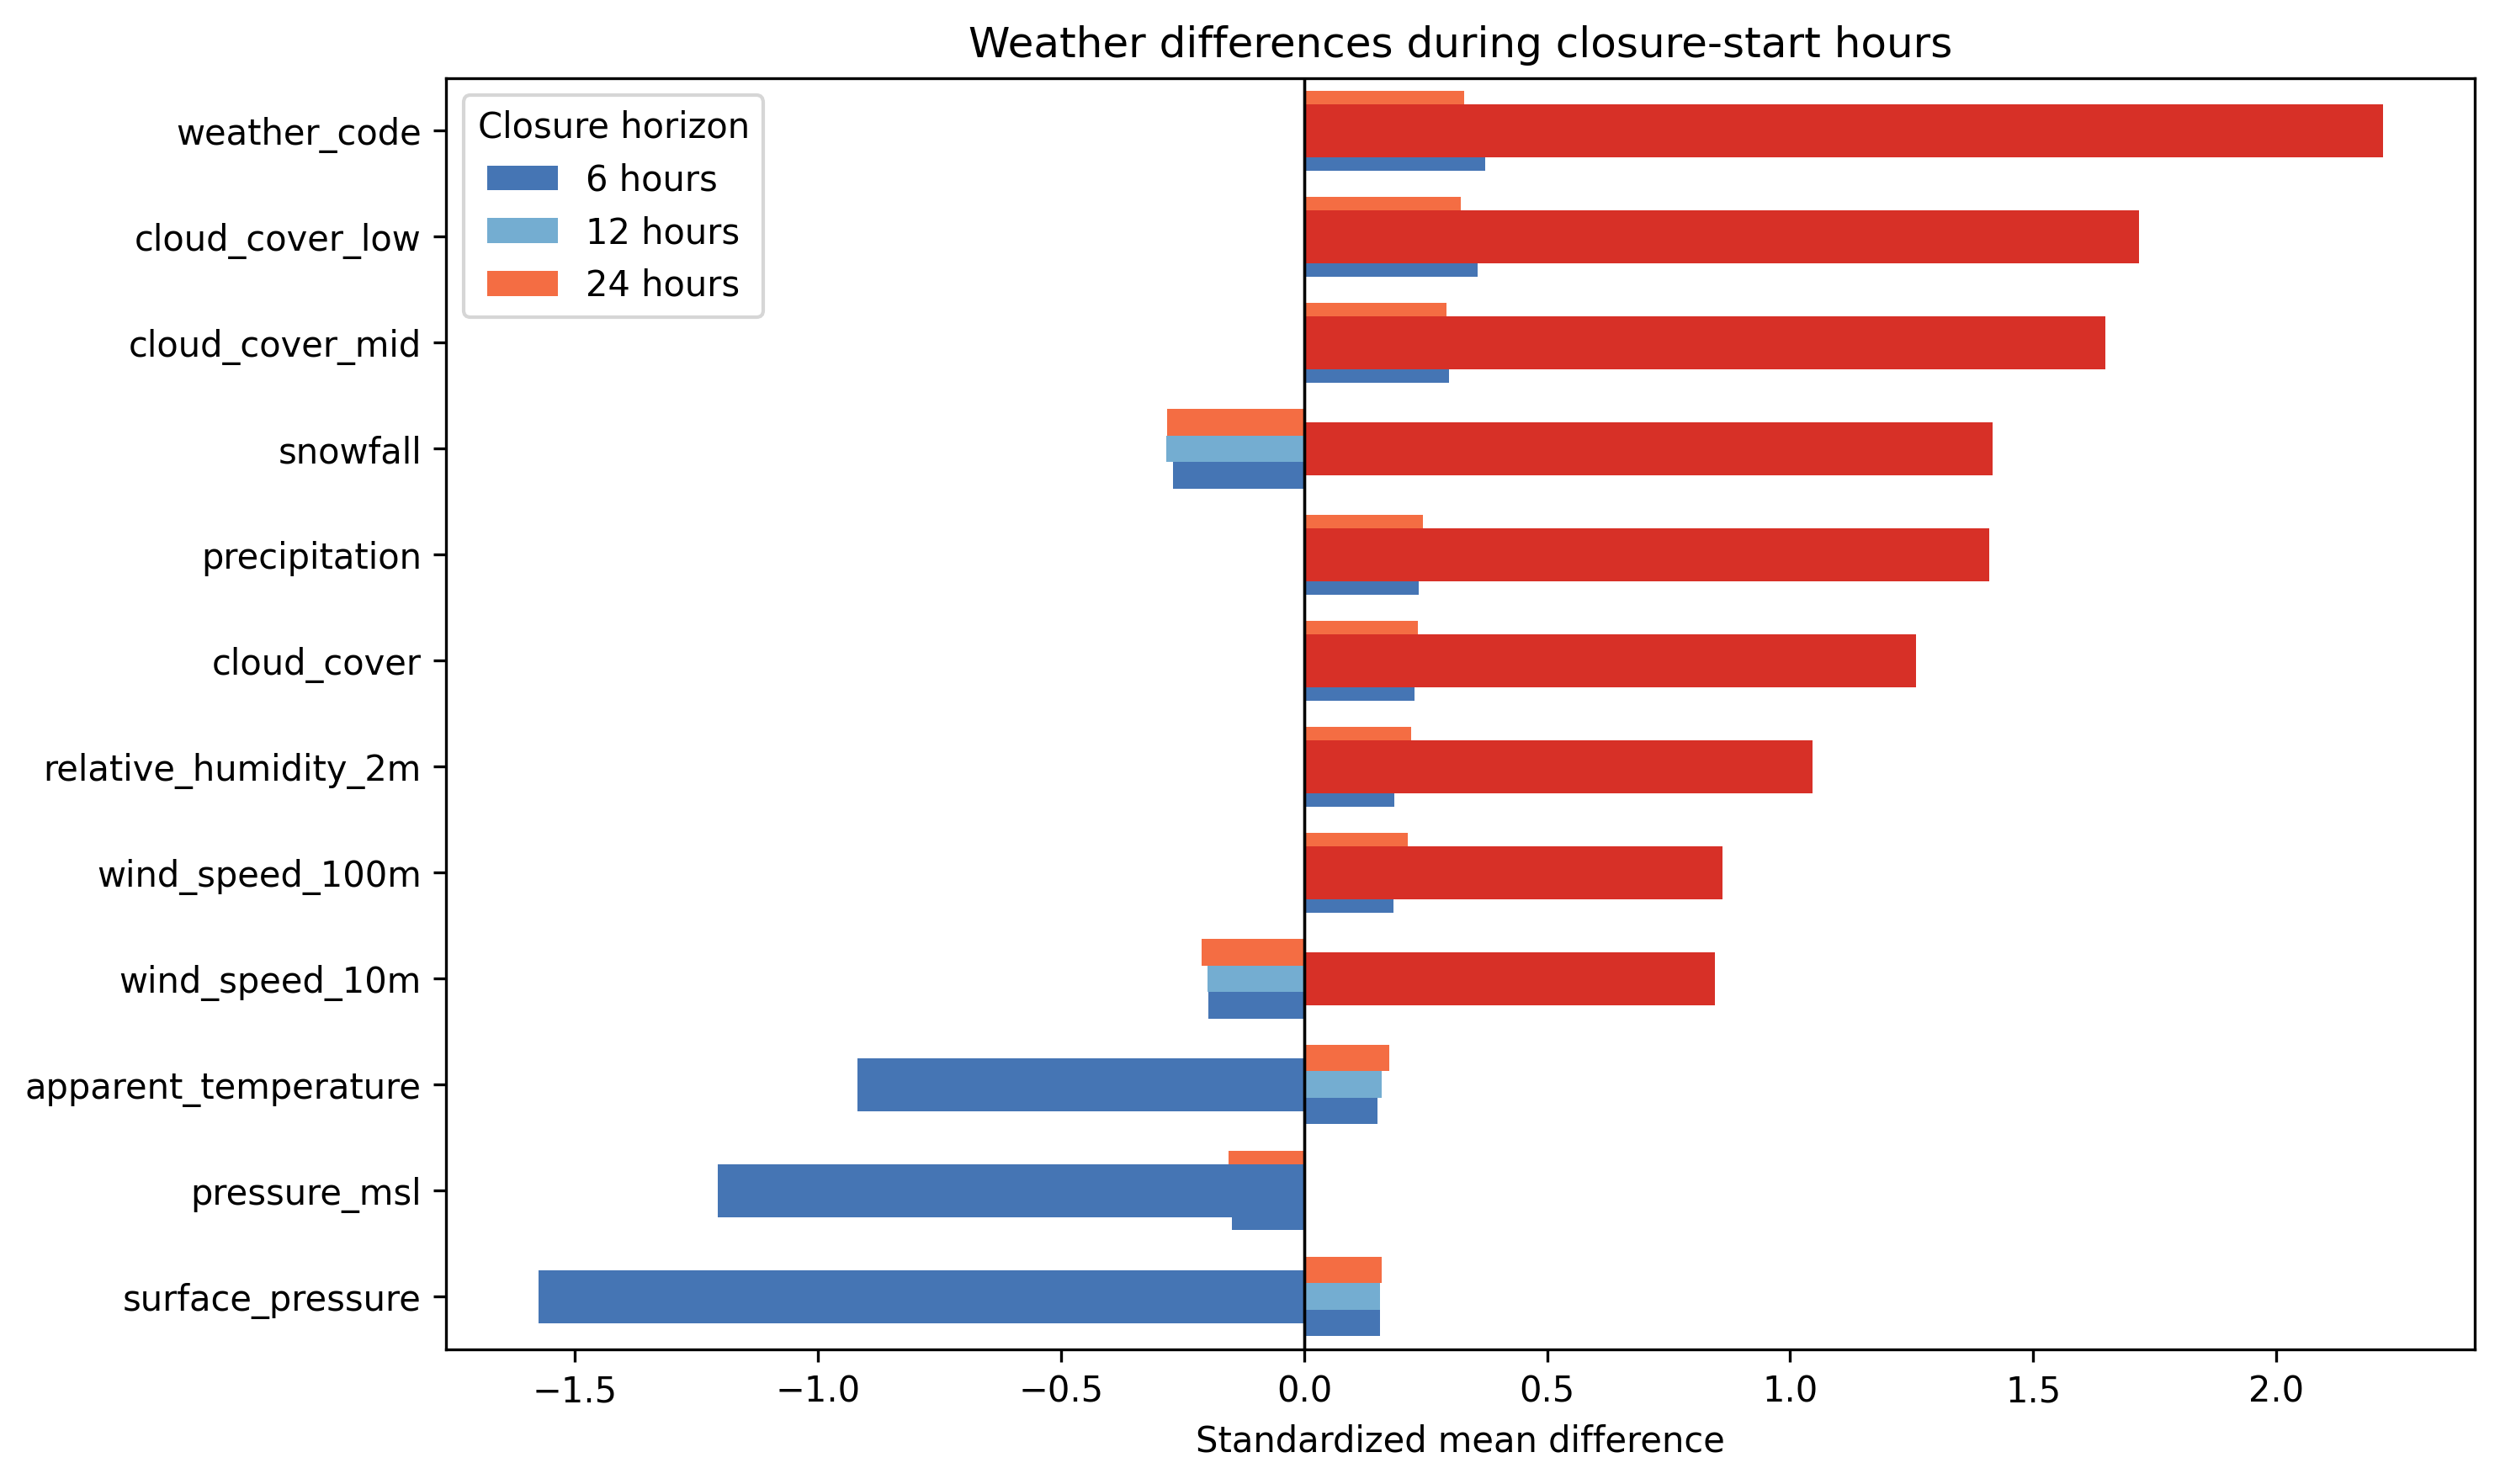
Standardized weather differences during I-80 closure-start hours
Closure starts occur under distinctly harsher weather, especially severe conditions, cloud cover, and snowfall.
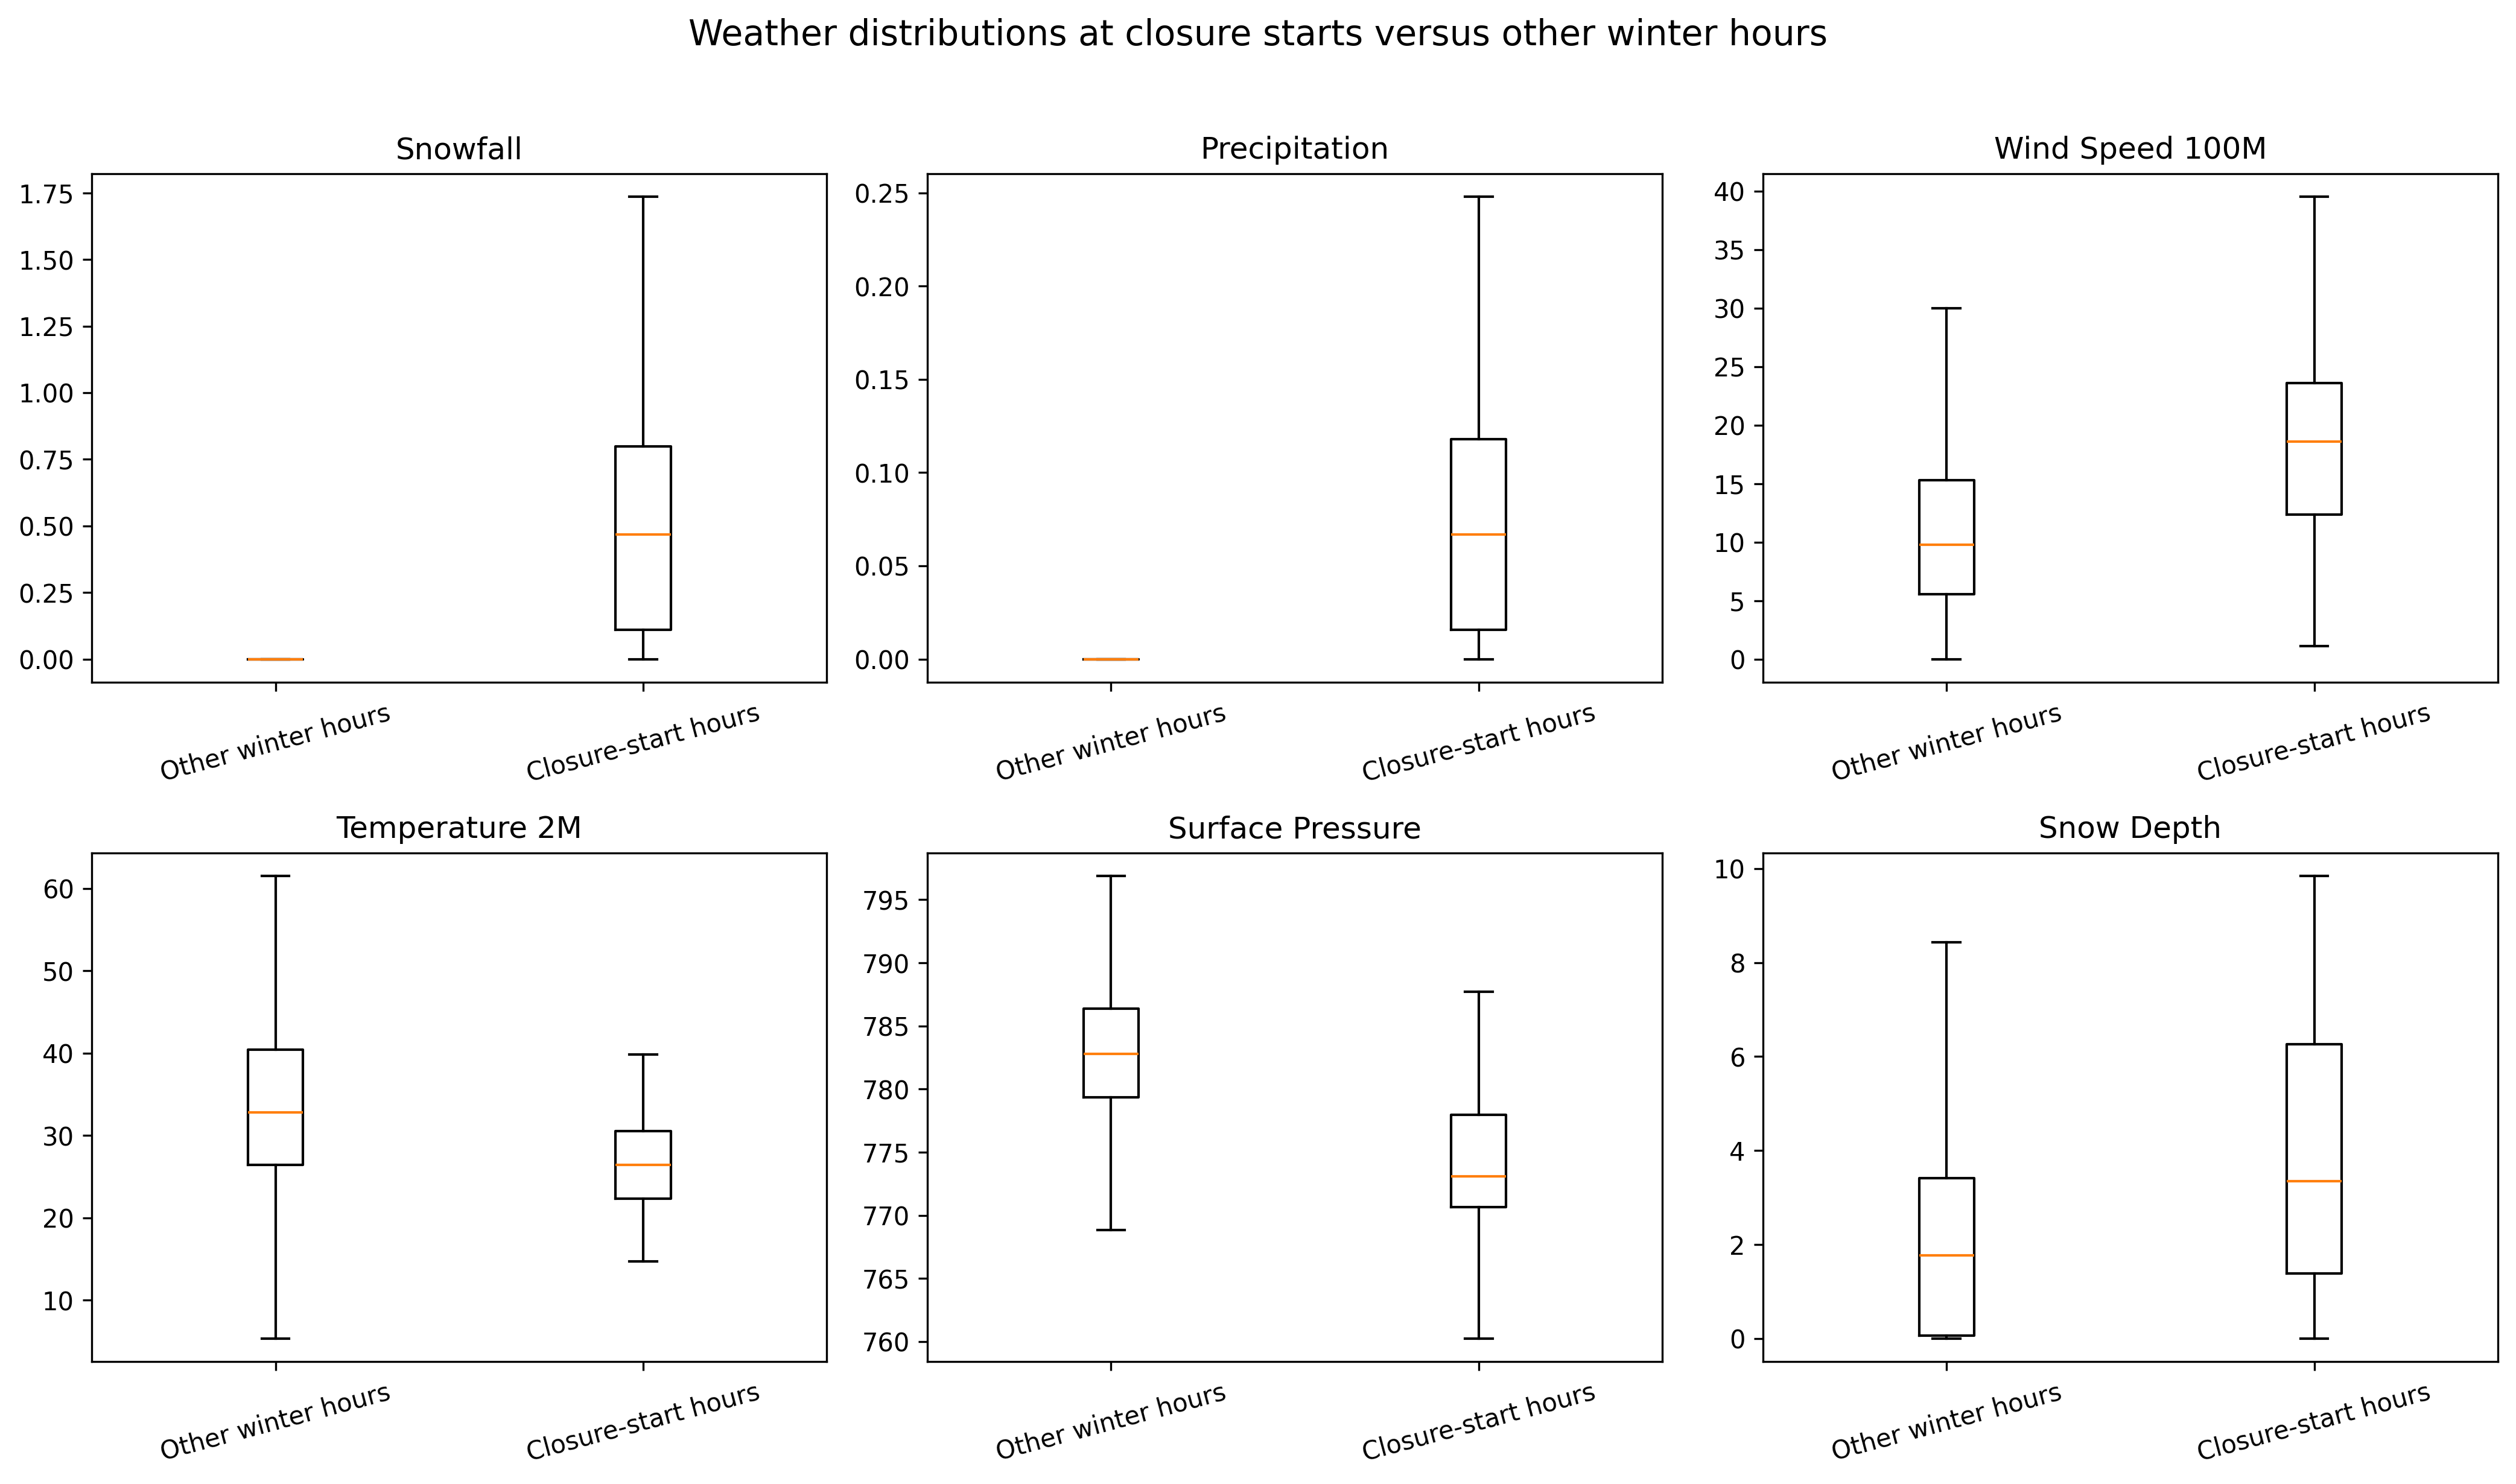
Weather distributions at closure starts compared with other winter hours
Closure-start hours combine more snow and precipitation, stronger winds, colder temperatures, and lower pressure.
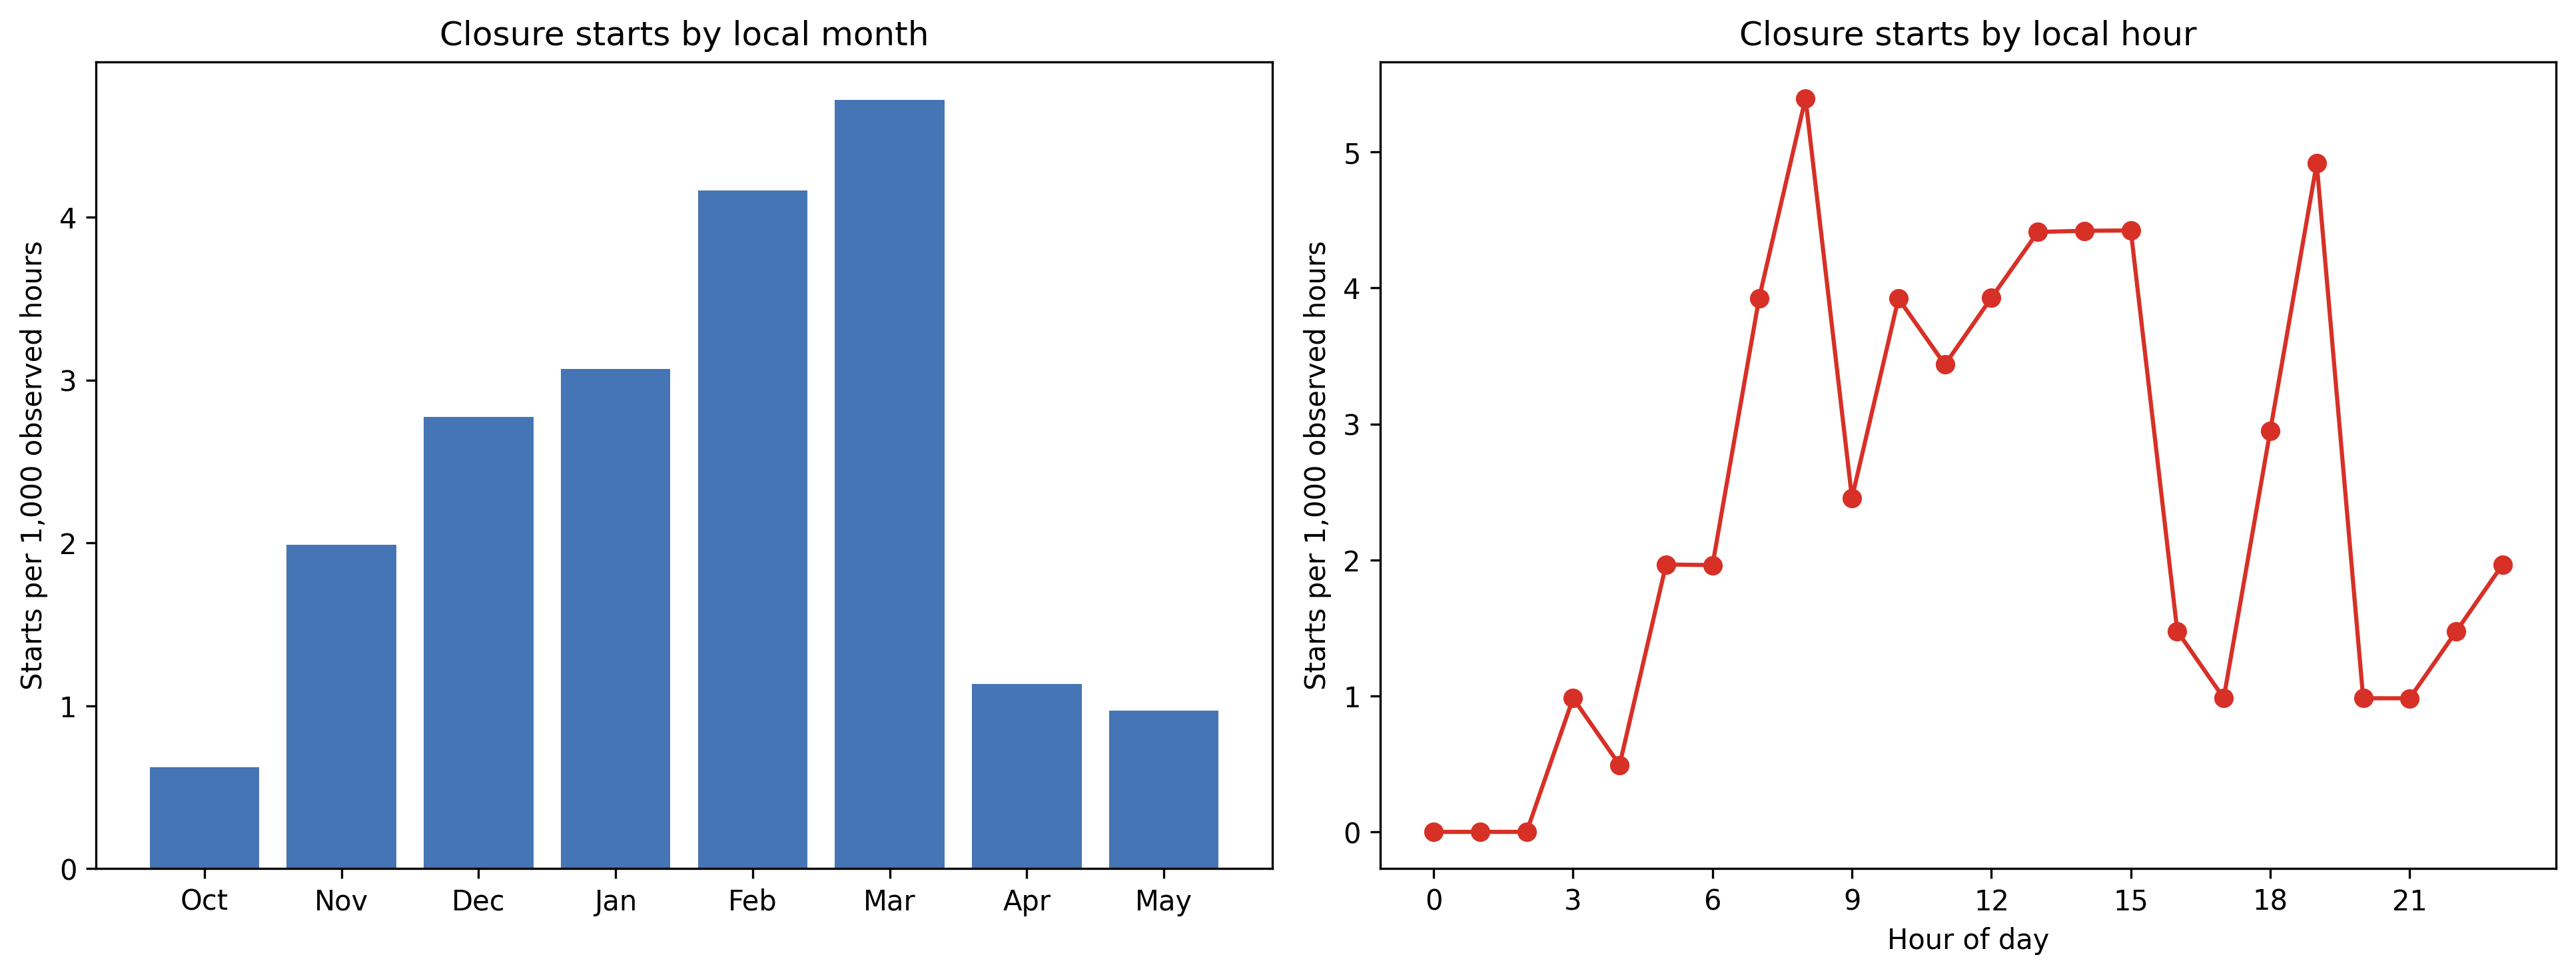
I-80 closure starts by local month and hour
Normalized closure starts peak during the core winter months and vary meaningfully by hour of day.
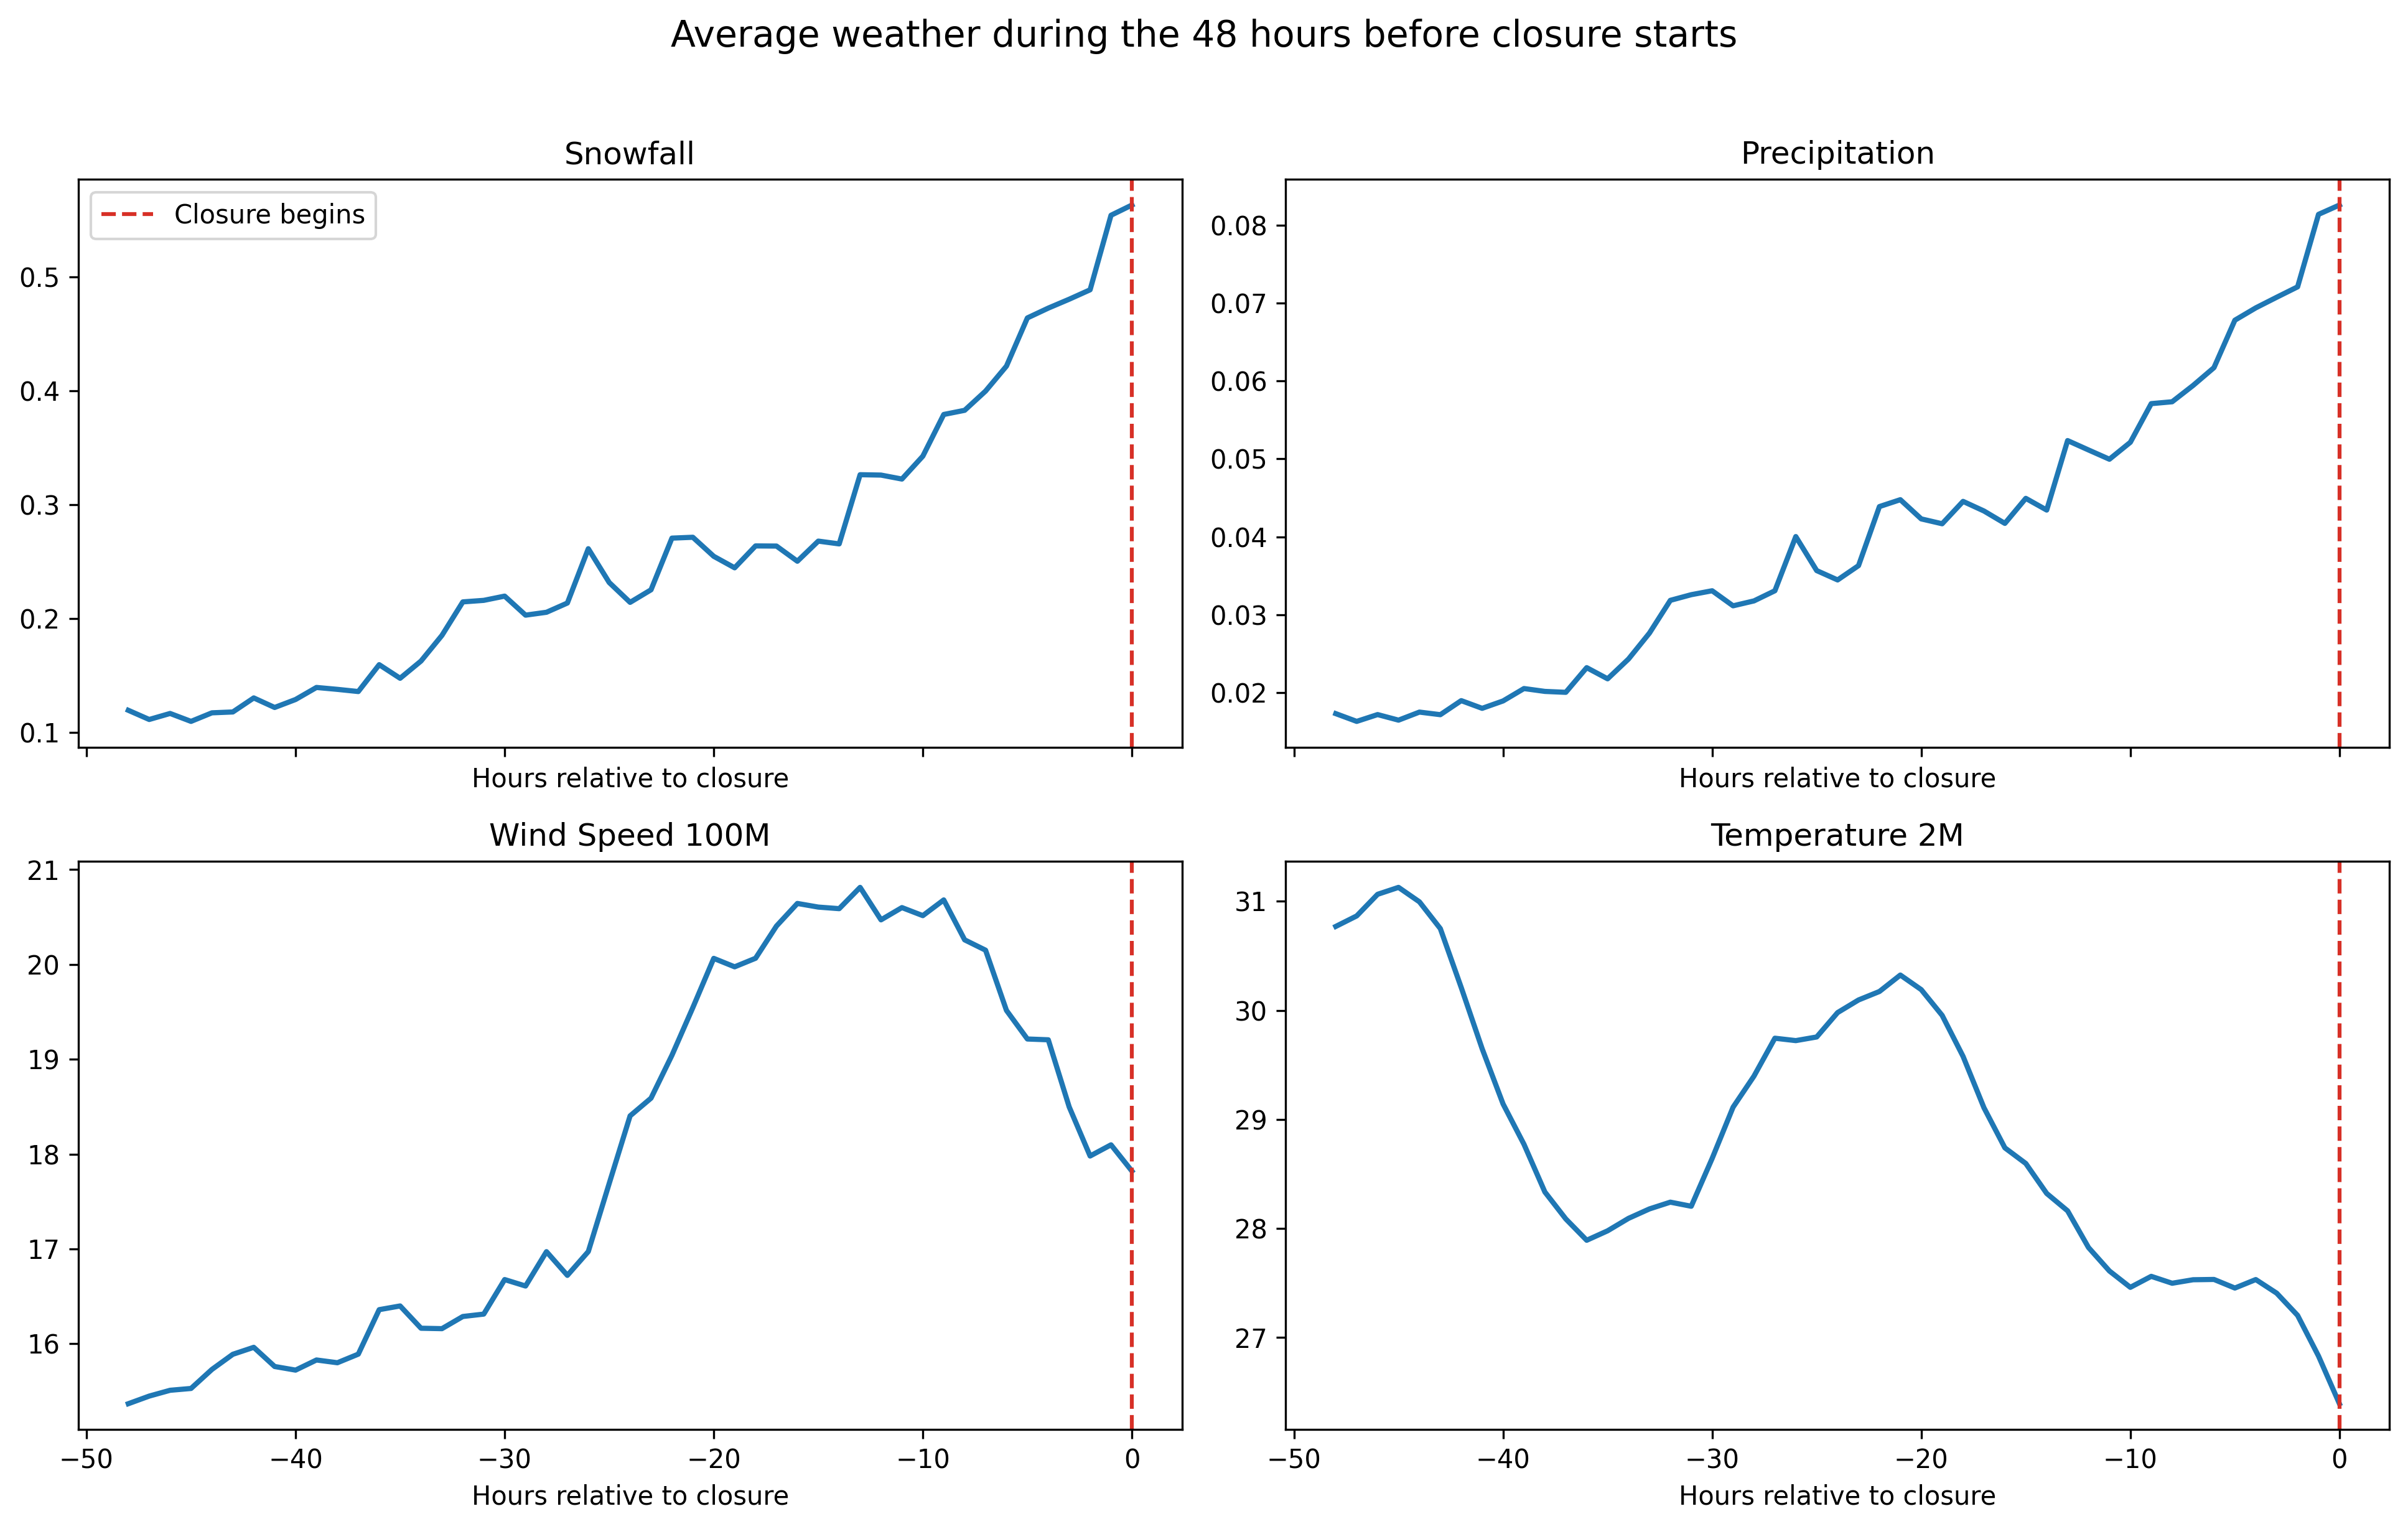
Average weather during the 48 hours before I-80 closures
Snowfall and precipitation build as closures approach while temperature falls, providing useful forecast signals.
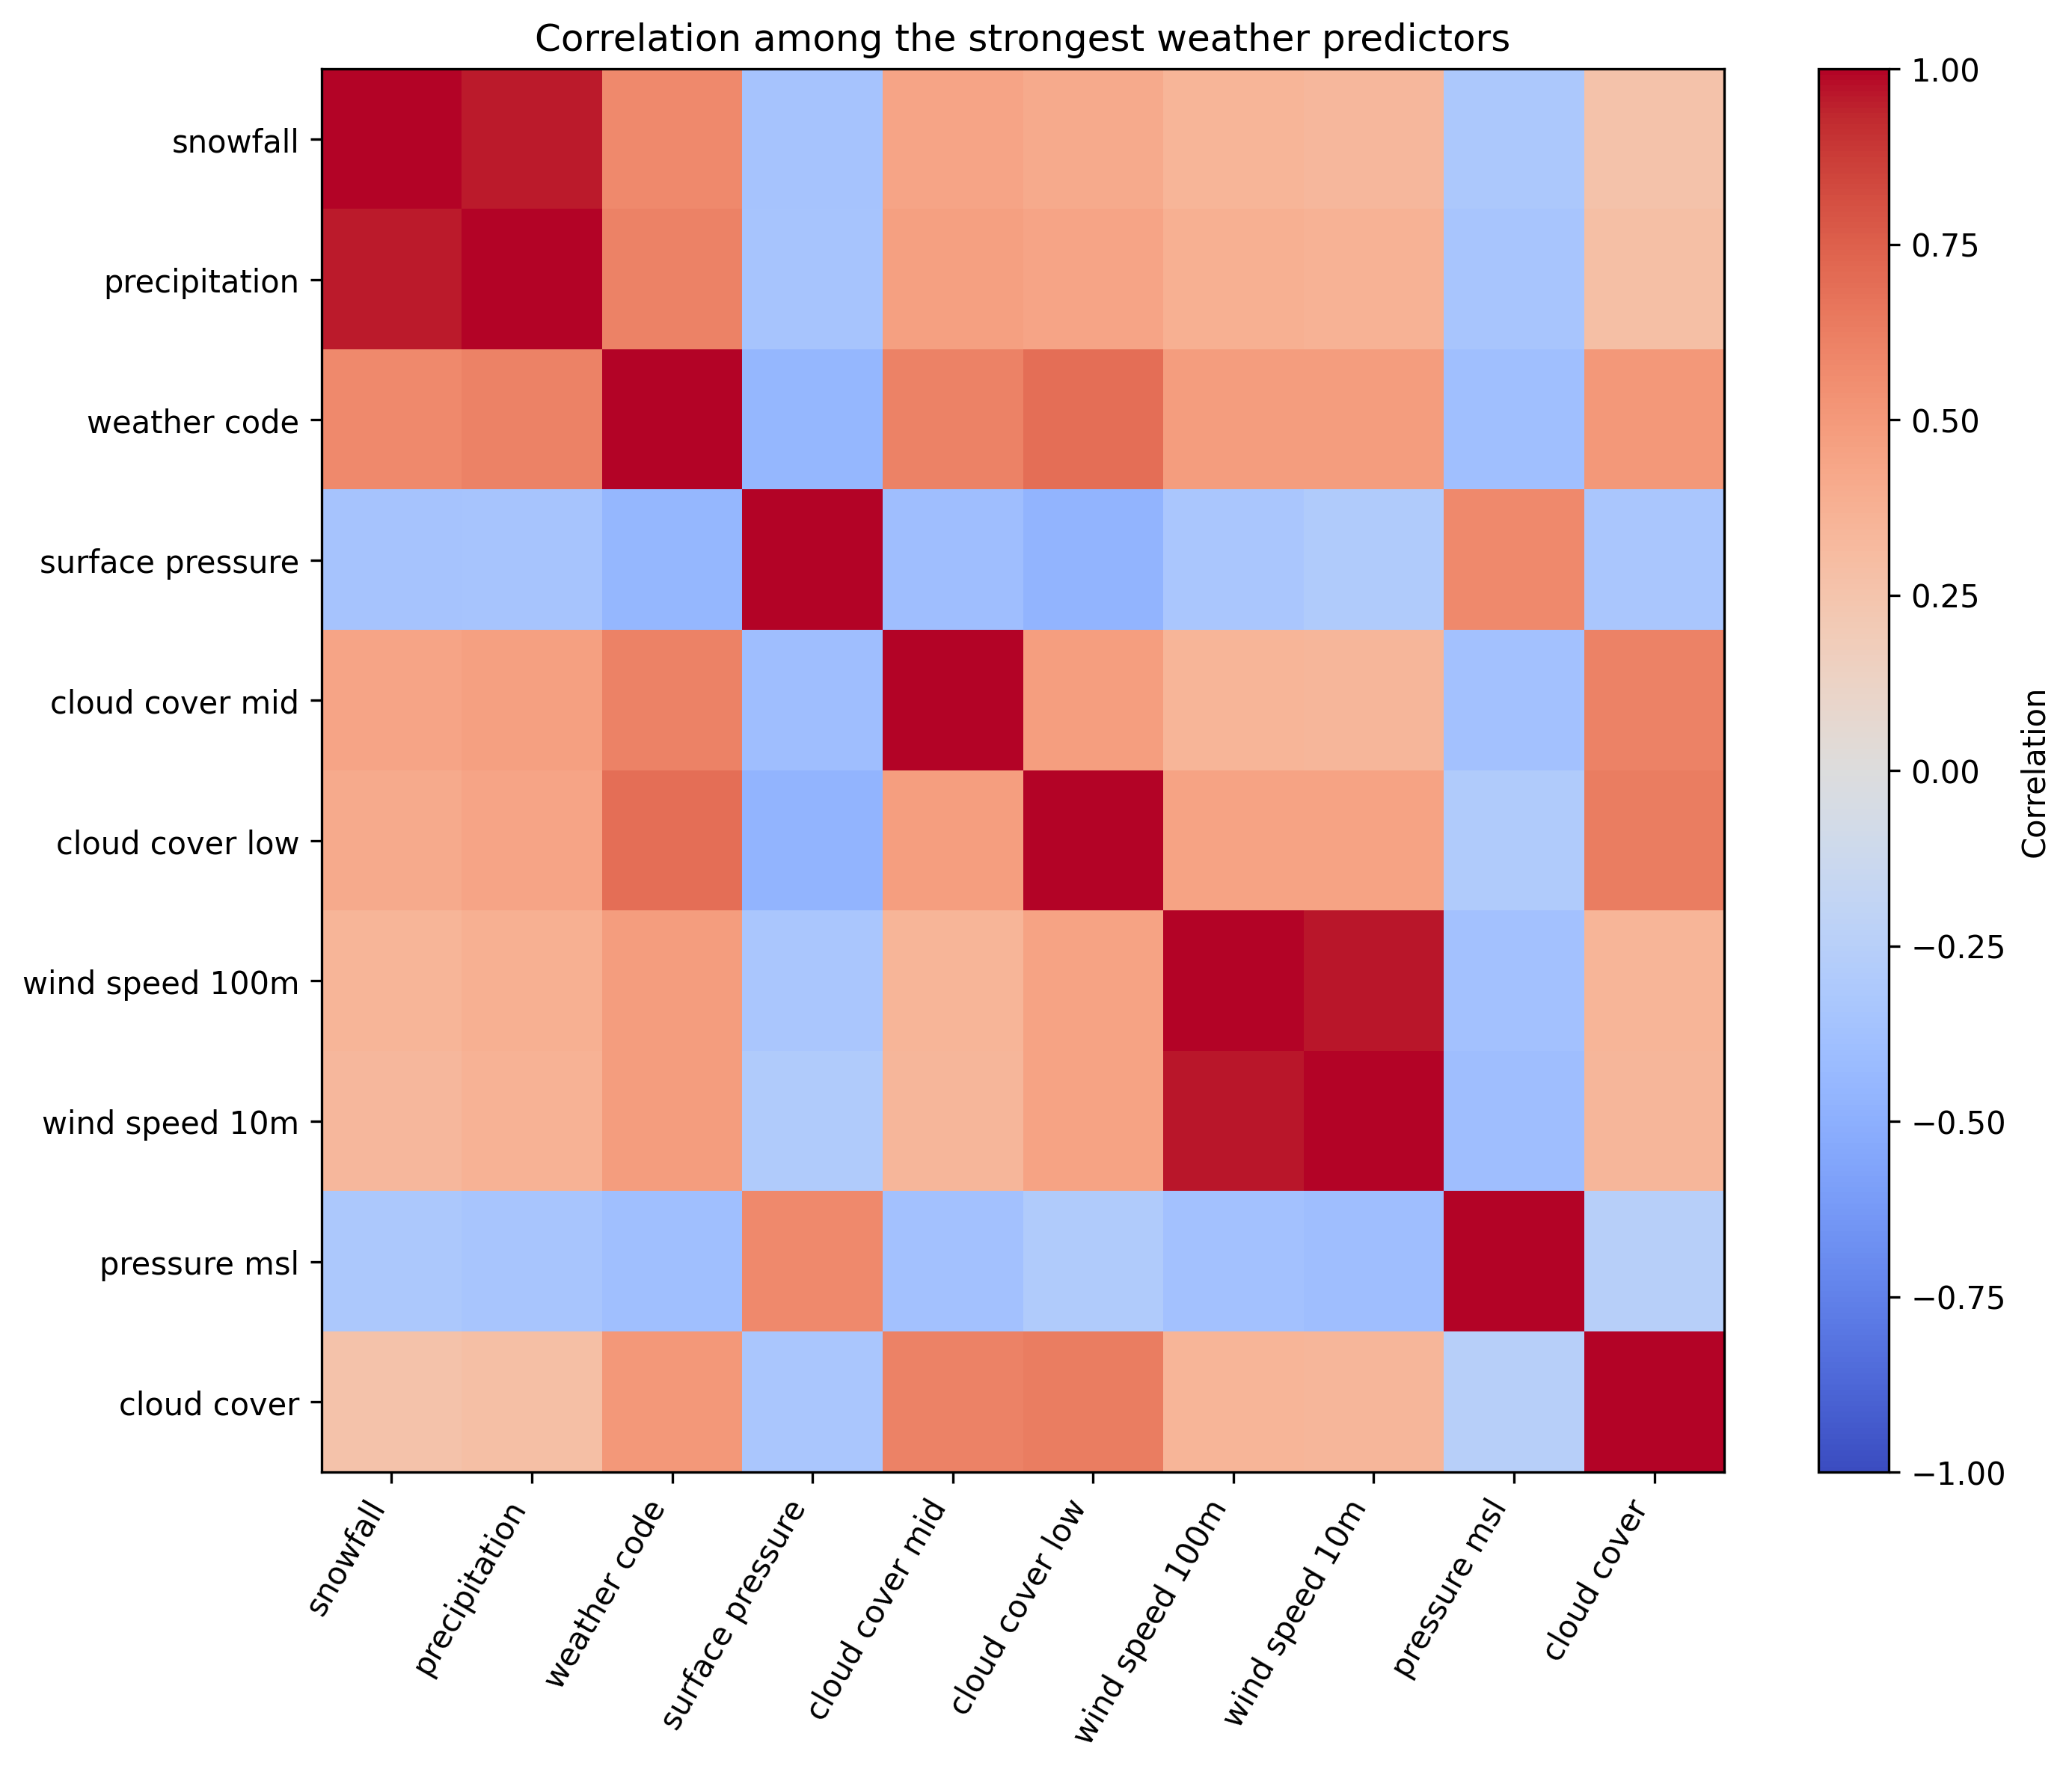
Correlation heatmap for the strongest road-closure weather predictors
Predictor correlations informed feature selection and helped identify overlapping weather signals.
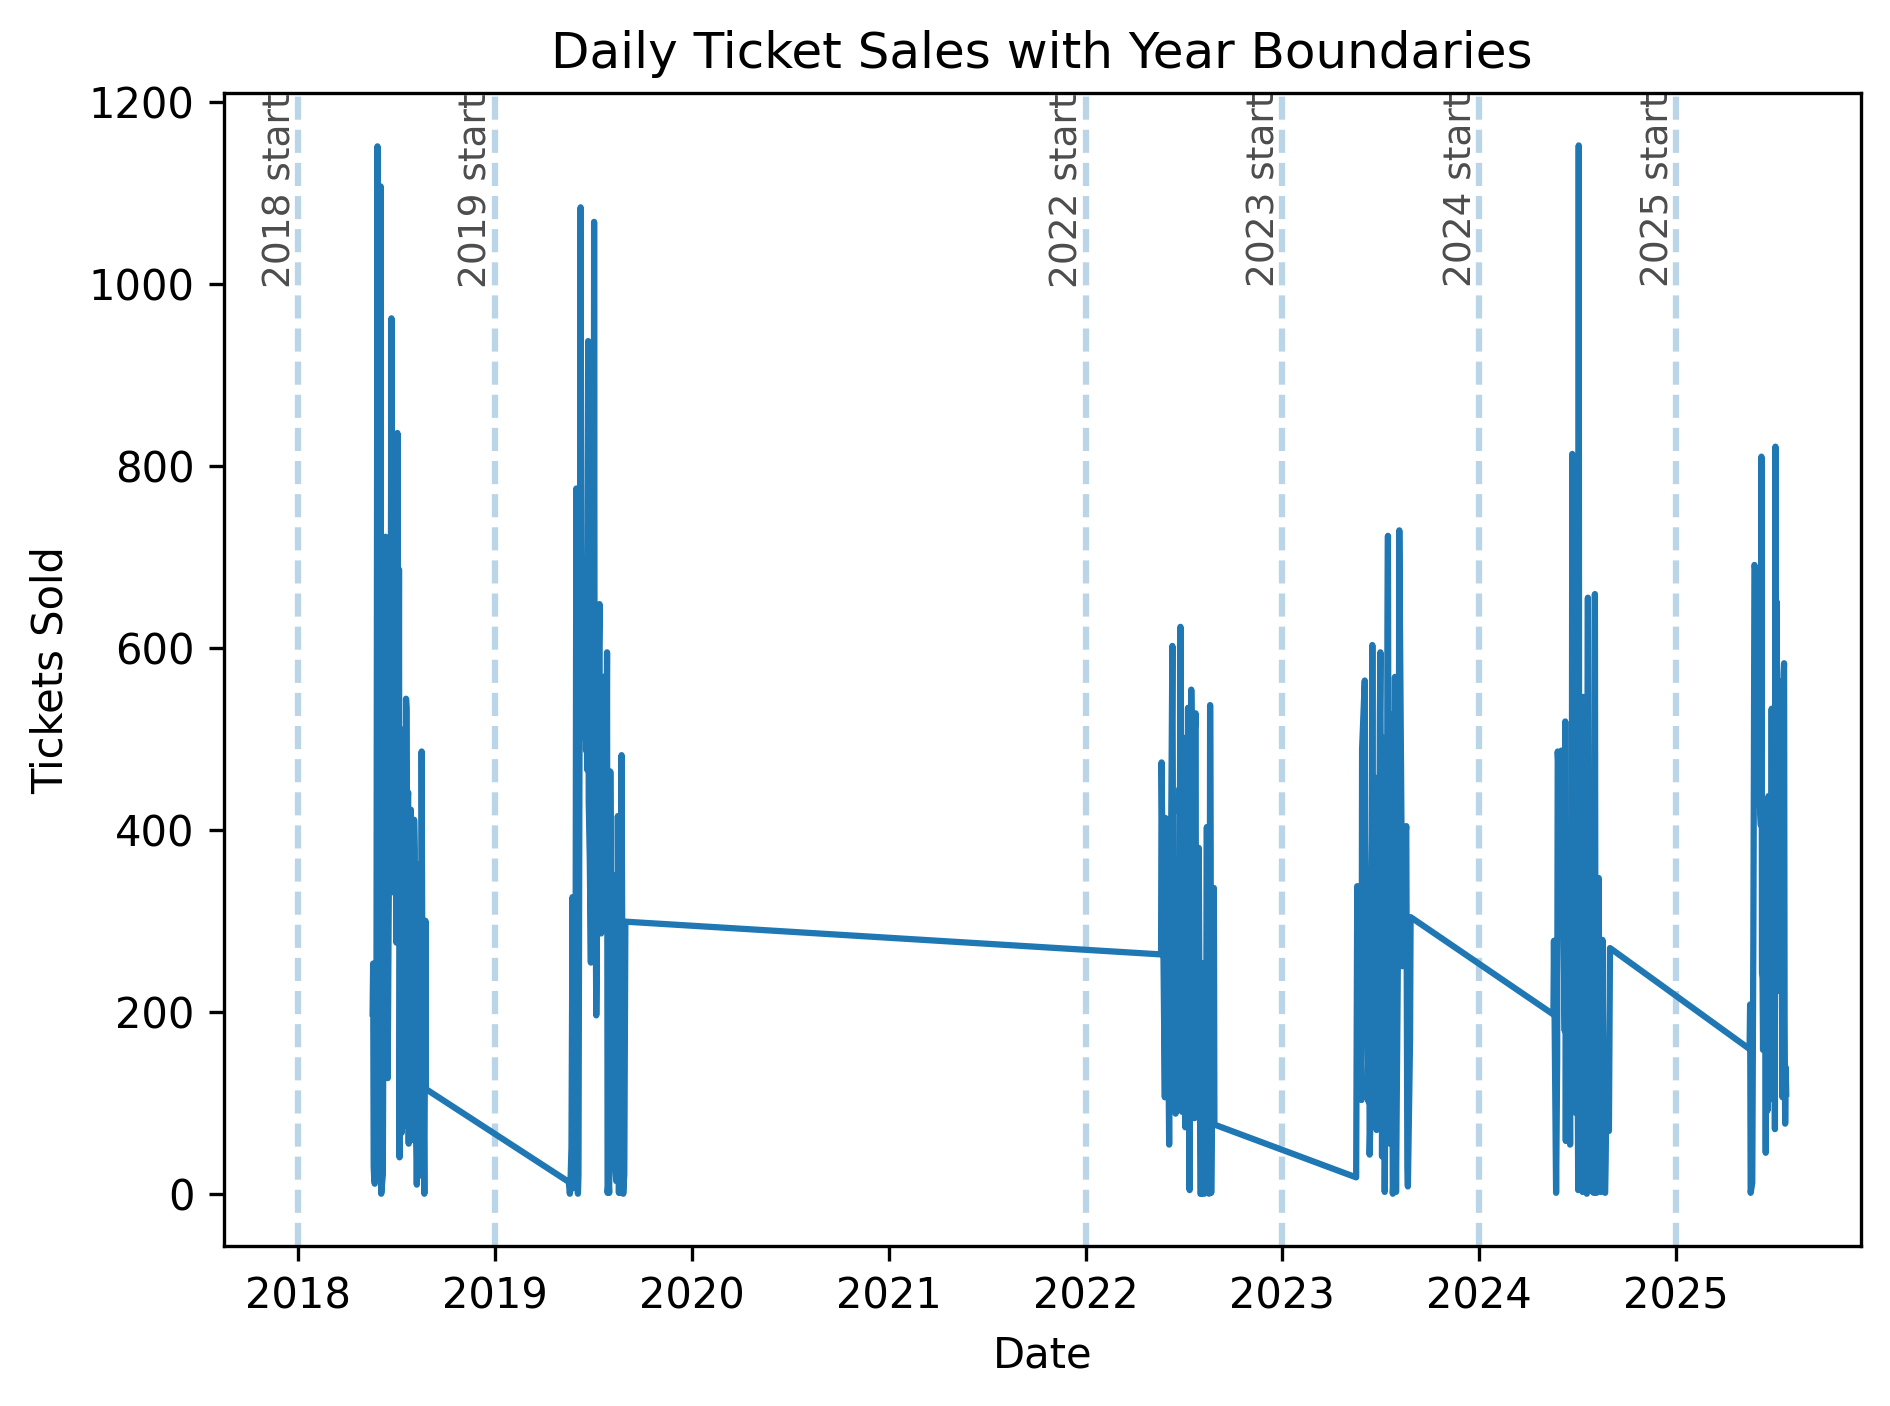
Ticket sales per year showing COVID impact
COVID-19 introduced a structural break in ticket demand, motivating year-level controls.
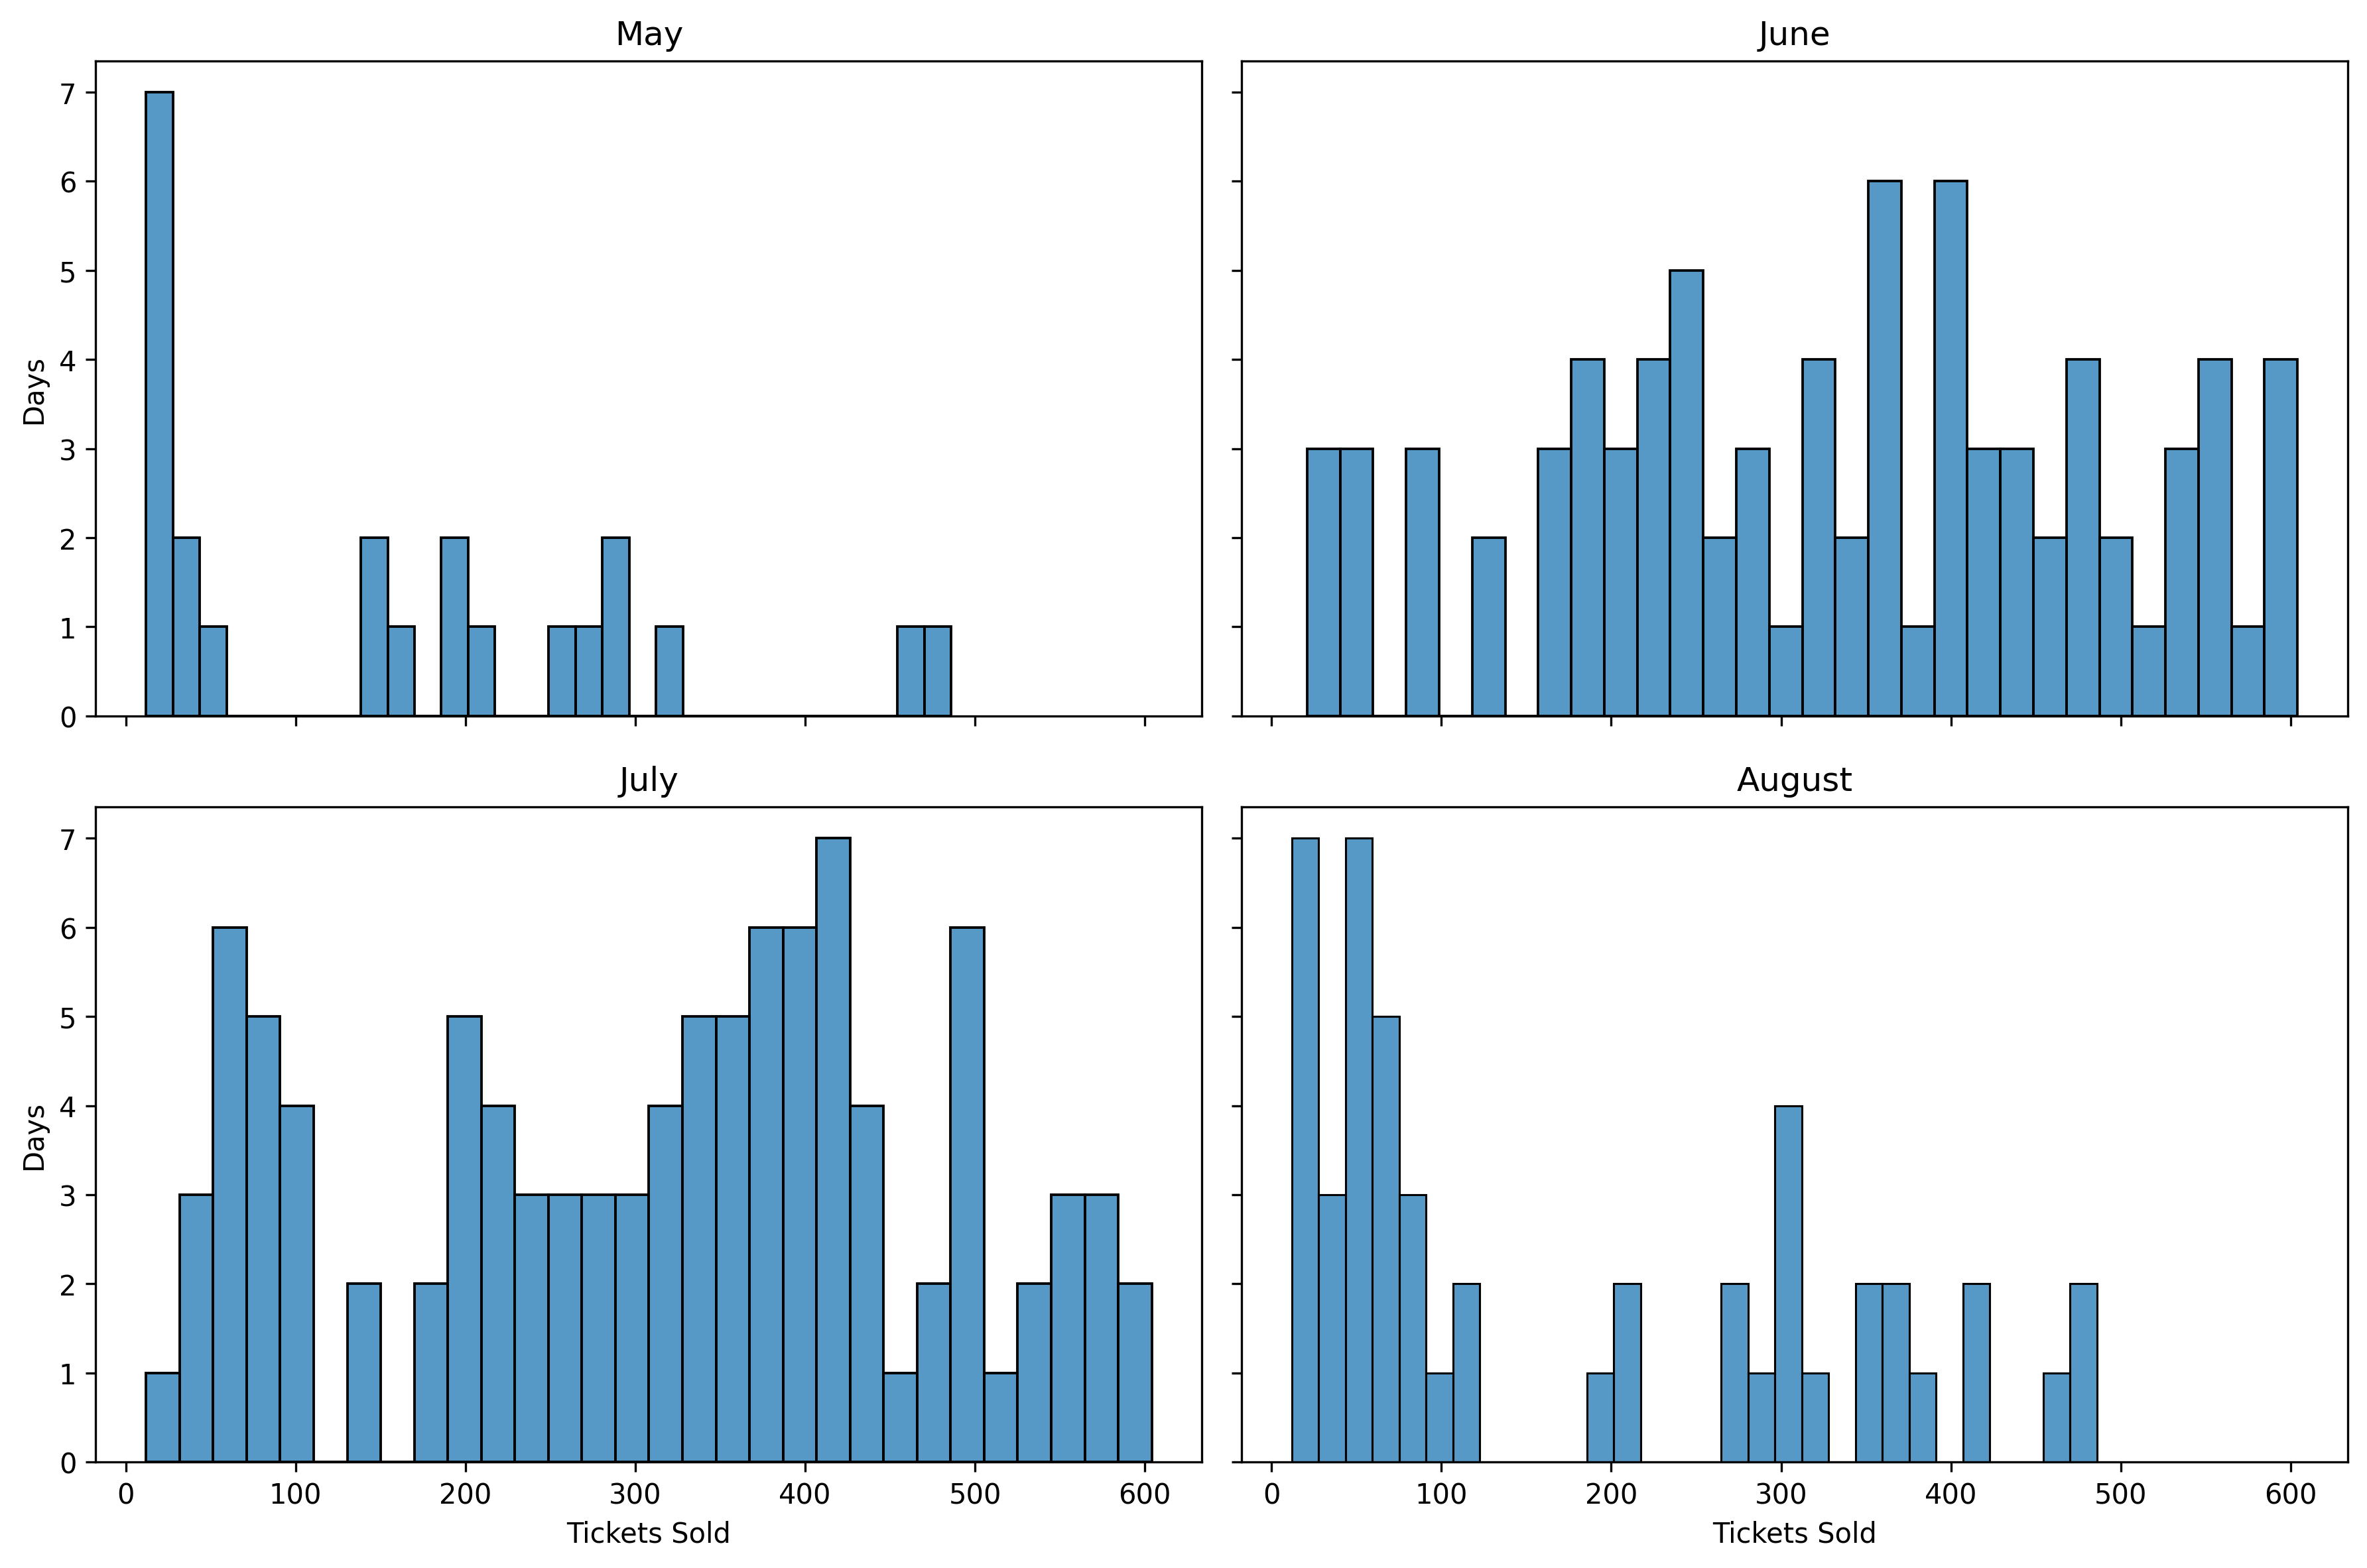
Ticket sales by month
Strong seasonal patterns justified month-based feature encoding.
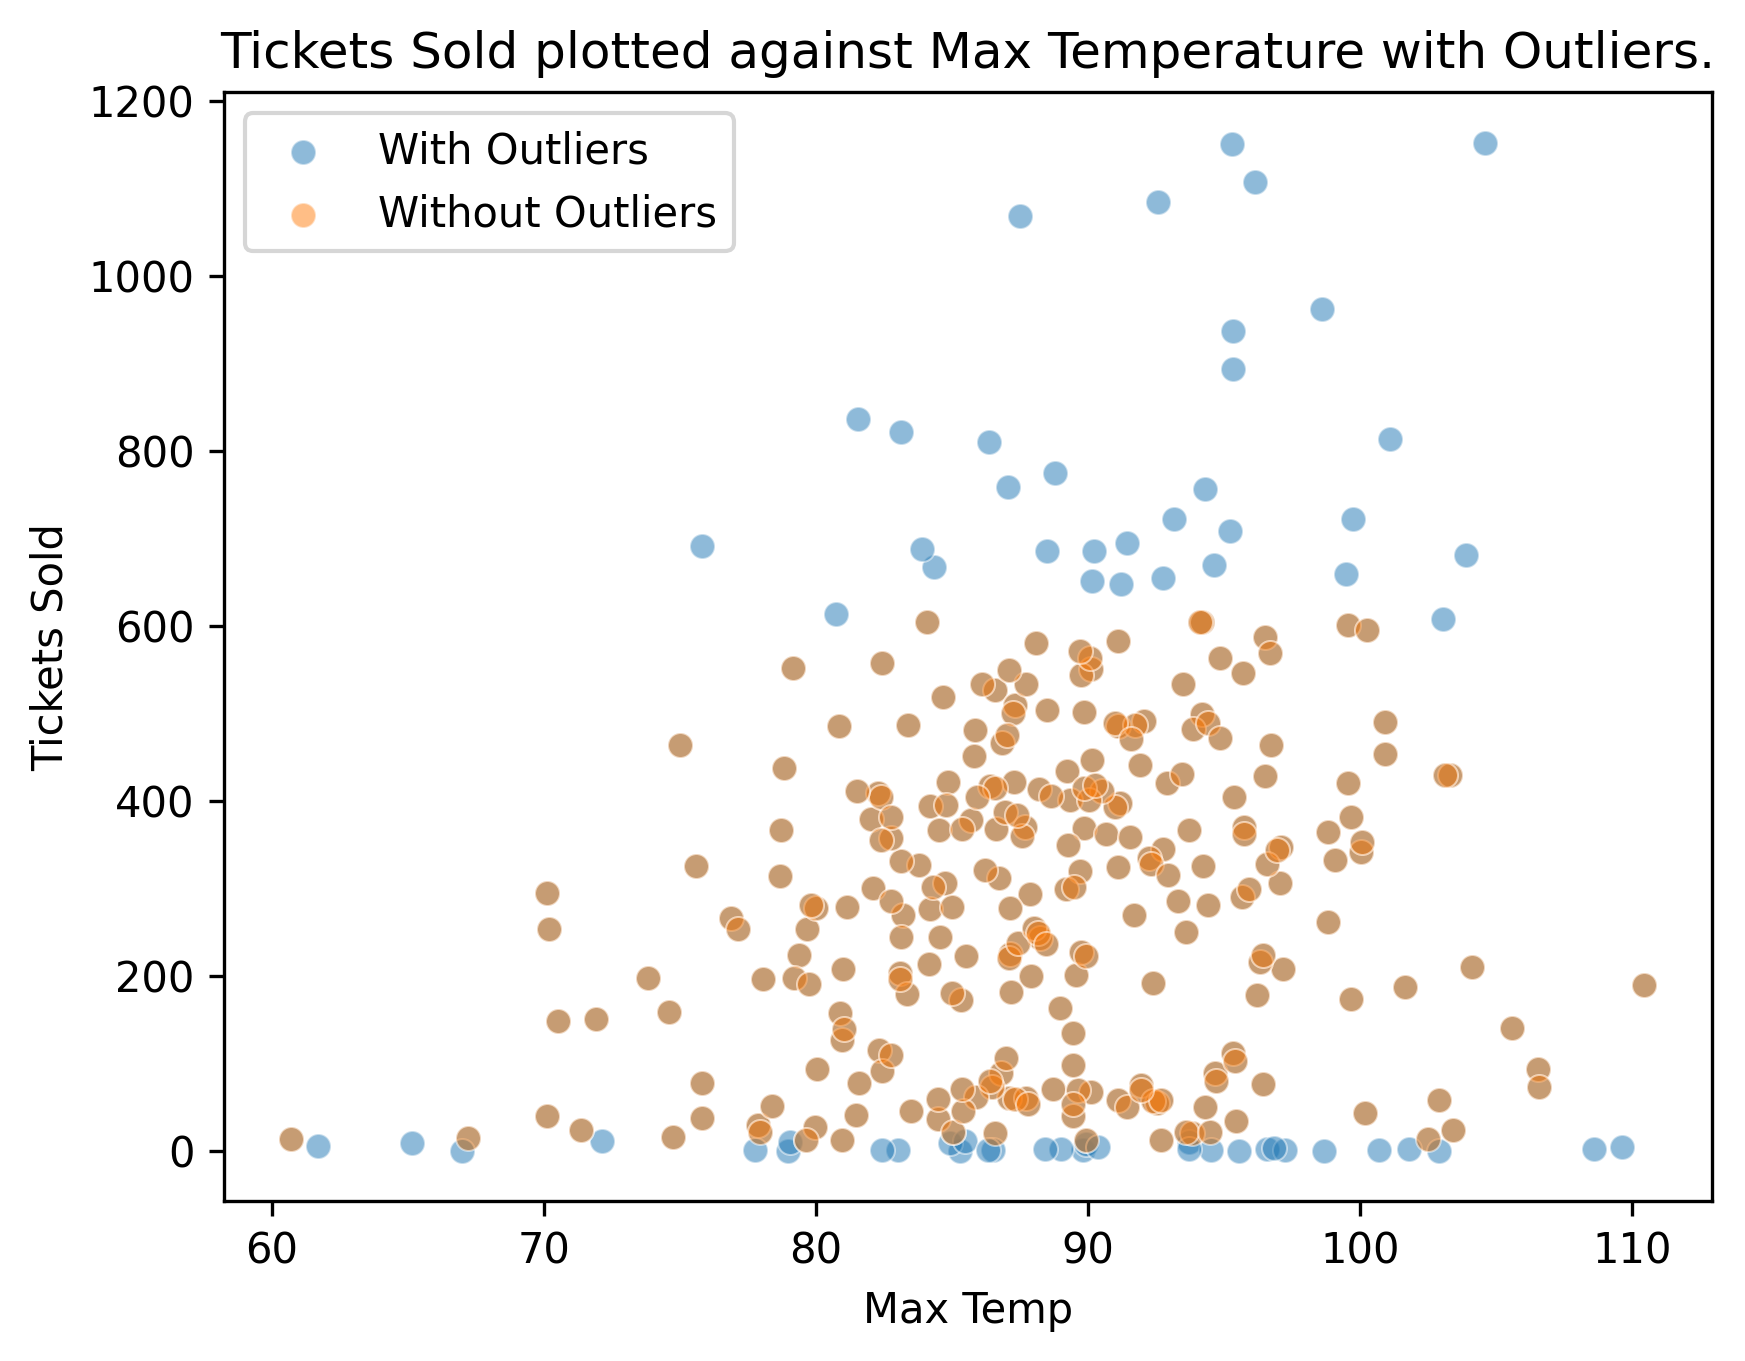
Ticket sales vs temperature
Ticket sales increase with temperature, with diminishing returns.
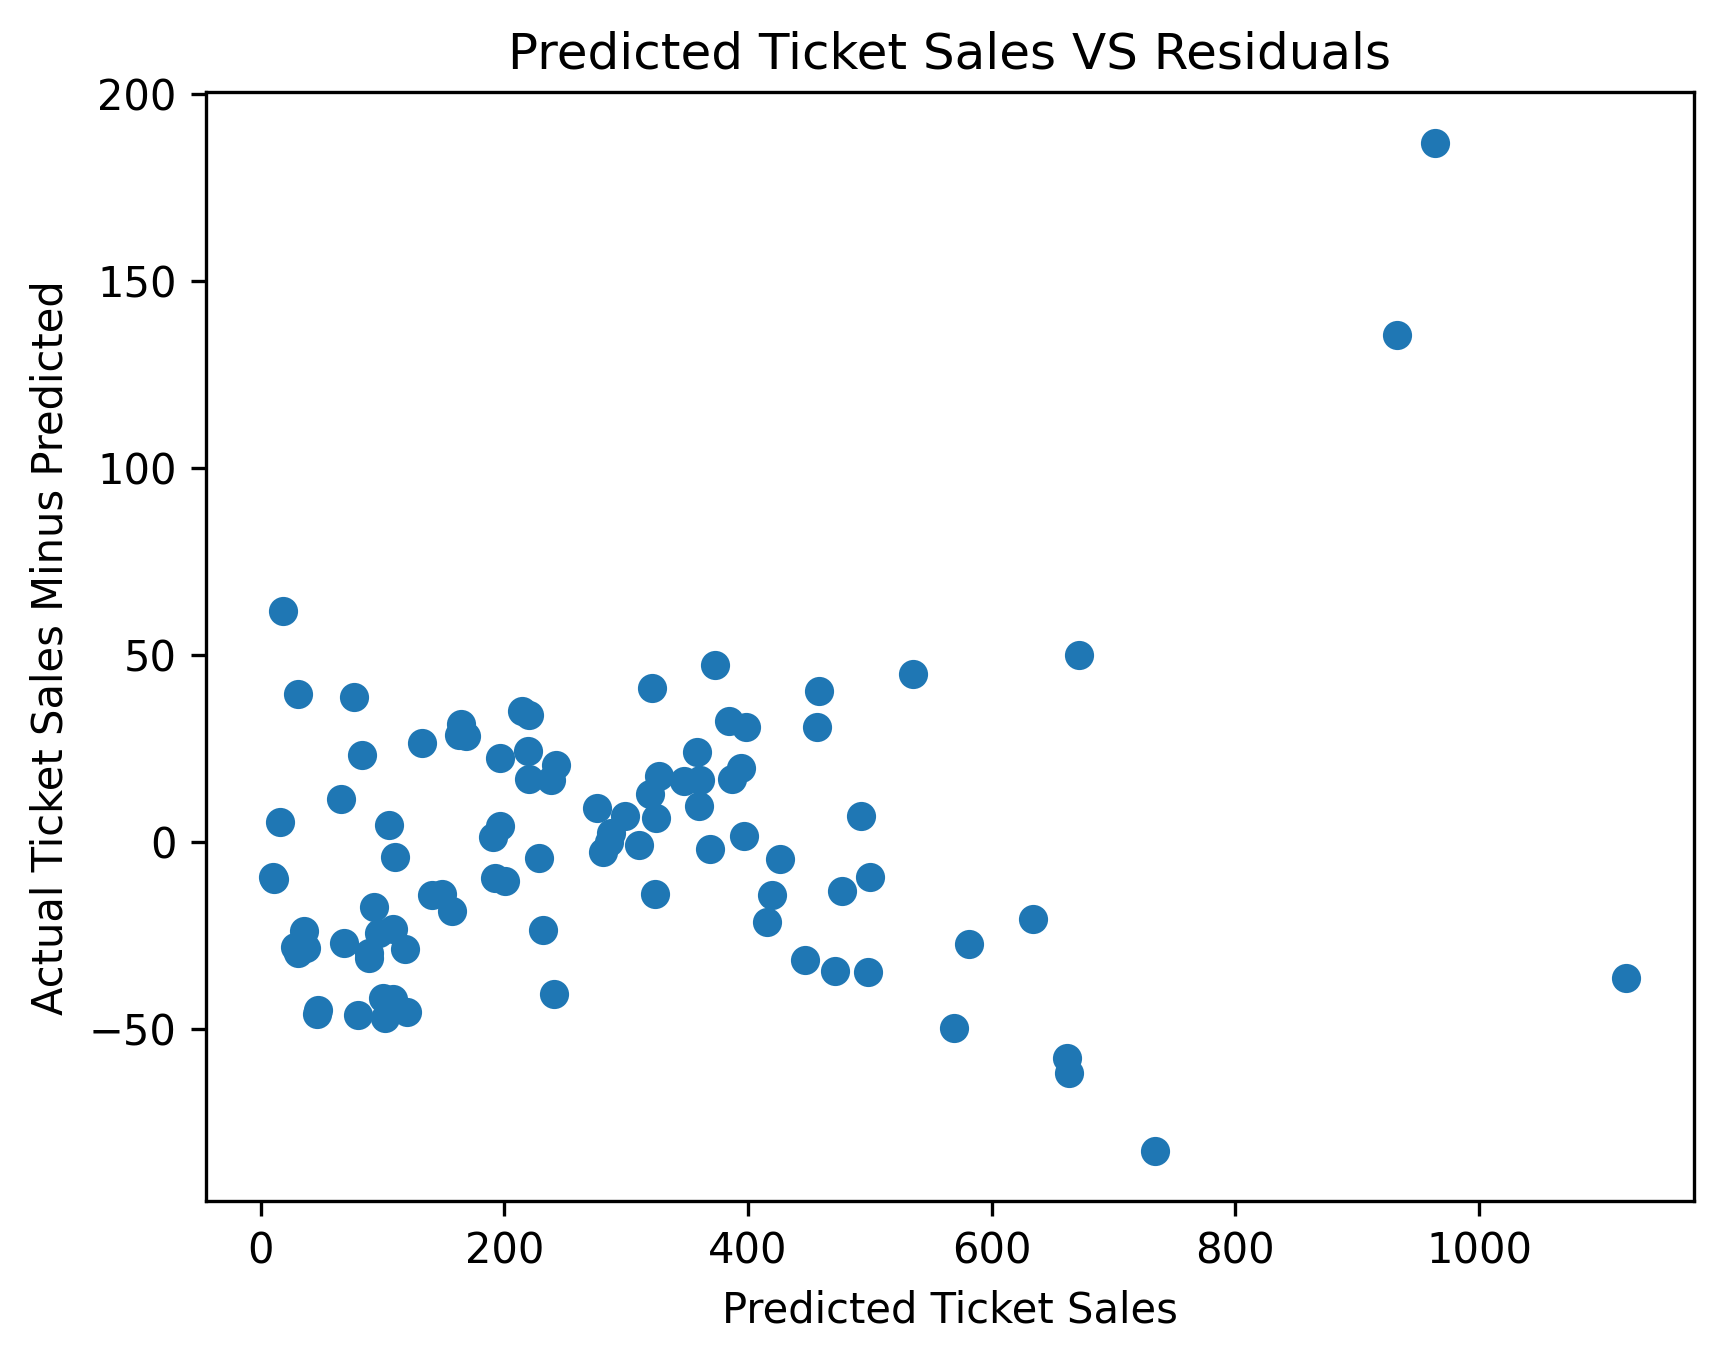
RMSE comparison across models
Linear regression outperformed a neural network baseline on test RMSE.

Coursework & Tools

Mathematics

Probability Linear Algebra Real Analysis

Used for bias/variance analysis, model assumptions, and uncertainty reasoning.

Languages & Web

Python SQL JavaScript HTML CSS

Data workflows, analysis, automation, and web interfaces.

ML & Data Libraries

pandas NumPy scikit-learn PyTorch

Feature engineering, model training, and evaluation pipelines.

Cloud & APIs

AWS Lambda Amazon S3 REST APIs Weather APIs

Scheduled data collection, cloud storage, and dashboard publishing.

Developer Tools

Git GitHub VS Code Jupyter

Methods & Workflow

Regression Time Series Cross-Validation Feature Engineering EDA Data Cleaning Error Analysis
How this shows up in my work:

I usually start with simple, interpretable models to build intuition, then layer on complexity only when it actually helps. I spend a lot of time on feature engineering and sanity-checking results so I understand what’s driving the predictions.


Side Quests

ME LILI Camping and climbing Brushing at GSF